
Figure 3.
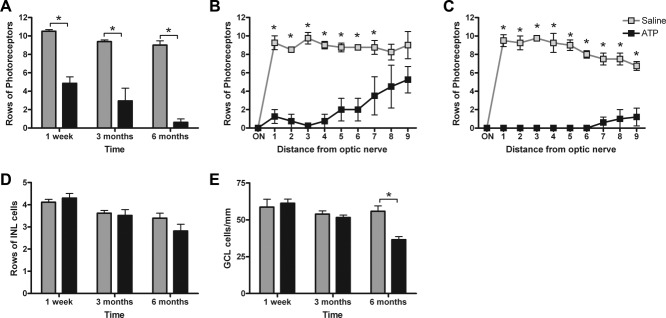
Quantification of the effects of 50 mM ATP on the gross structure of the retina at 1 week, 3 months, and 6 months. A: The average number of rows of photoreceptor nuclei was quantified for saline-treated (gray bars) and ATP-treated (black bars) eyes at 1 week, 3 months, and 6 months. B,C: To determine whether there was an effect across eccentricity, rows of photoreceptor nuclei were also quantified at 10 regions across the retina from the optic nerve (ON) to the peripheral ciliary body at 3 months (B) and 6 months (C). D: The average number of rows of inner nuclear layer cells quantified in saline-treated (gray bars) and ATP-treated (black bars) eyes at 1 week, 3 months, and 6 months. E: The average number of cells across the ganglion cell layer were also quantified. Significance of P < 0.05 between saline-treated (n = 6) and ATP-treated (n = 6) eyes indicated by an asterisk.