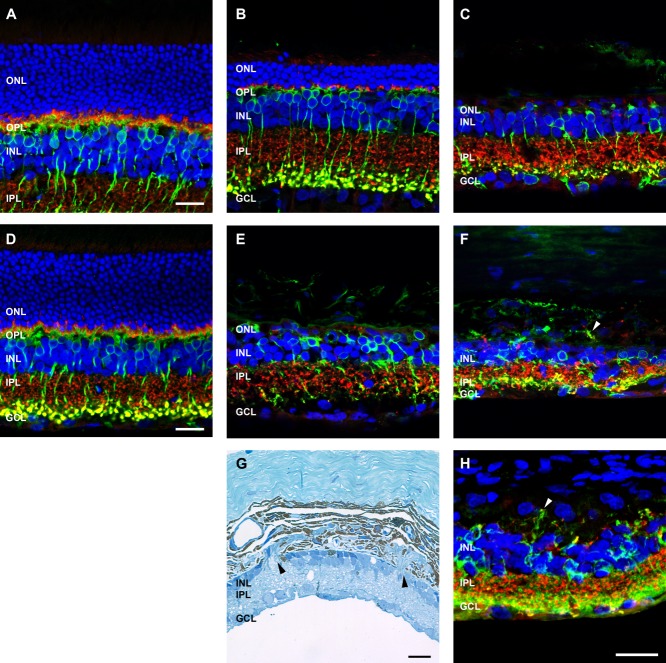
Figure 5.
Rod bipolar cell morphology following ATP-induced photoreceptor degeneration and in P23H rat retinae. Sections of retinae from saline- and ATP-treated rat eyes and a 2-year-old P23H rat retina for comparison were labeled for rod bipolar cells (PKCα, green), photoreceptor and bipolar cell terminals (VGLUT1, red), and cell nuclei (DAPI, blue). A–C: ATP-treated rat retinae at 3 months (A: saline; B,C: ATP). D–F: ATP-treated rat retinae at six months (D: saline; E,F: ATP). For each time point for ATP-treated retinae, two example regions are presented. G: Light microscopic image of ATP-treated rat retina at 6 months. H: Two-year-old P23H rat retina. Arrowheads in F,H indicate extreme remodeling event of VGLUT1/PKCα-positive synapses displaced into the choroid in 6 month ATP retina (F) and 2-year-old P23H rat retina (H). ONL, outer nuclear layer; OPL, outer plexiform layer; INL, inner nuclear layer; IPL, inner plexiform layer; GCL, ganglion cell layer. Scale bars = 20 μm.

