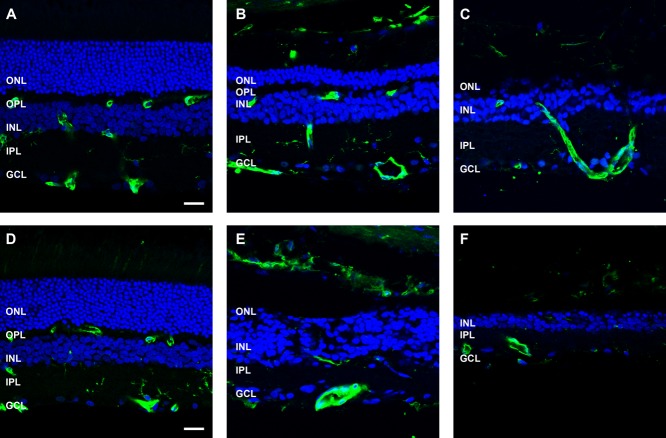
Figure 8.
Blood vessel morphology following ATP-induced photoreceptor degeneration. Sections of retinae from saline- and ATP-treated eyes were labeled for blood vessels (isolectin B4, green) and cell nuclei (DAPI, blue) at 3 months (A: saline; B,C: ATP) and 6 months (D: saline; E,F: ATP) post-injection. For each time point, two example regions of ATP-treated retinae are presented. ONL, outer nuclear layer; OPL, outer plexiform layer; INL, inner nuclear layer; IPL, inner plexiform layer; GCL, ganglion cell layer. Scale bars = 20 μm.

