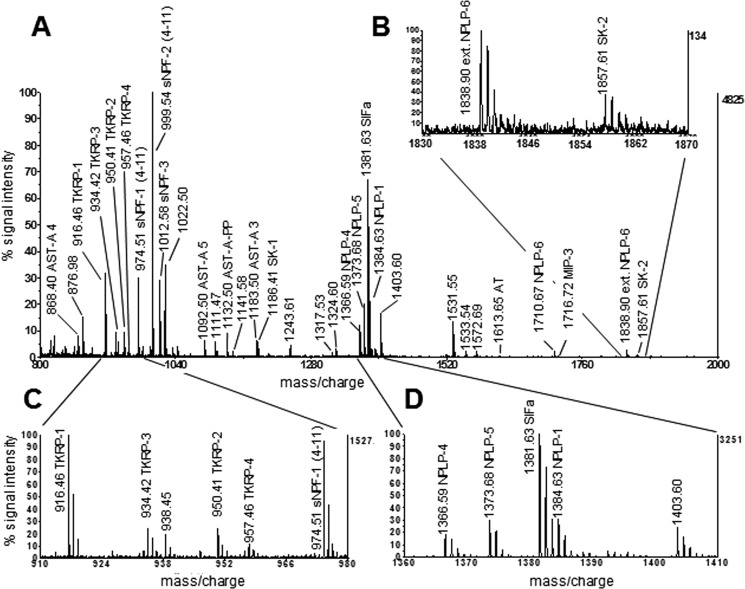
Figure 1.
A: A representative MALDI-TOF mass spectrum obtained after direct profiling a single female Ae. aegypti AL. Insets B–D: Magnified views of A. Left y-axis: relative signal intensity after autoscaling to maximum peak intensity in the selected mass range; right y-axis: peak intensity in absolute counts.

