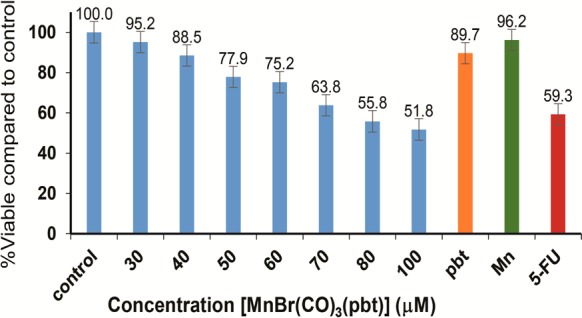
Figure 6.

Dose dependent cell viability of MDA-MB-231 (blue bar) cells upon treatment with CO photoreleased from 1. The orange and green bars represent the cell viability upon treatment with 100 μM PBT and MnSO4, respectively, and the red bar indicates the cell viability with 5-fluorouracil (25 μM). All samples were illuminated with a broadband visible light.
