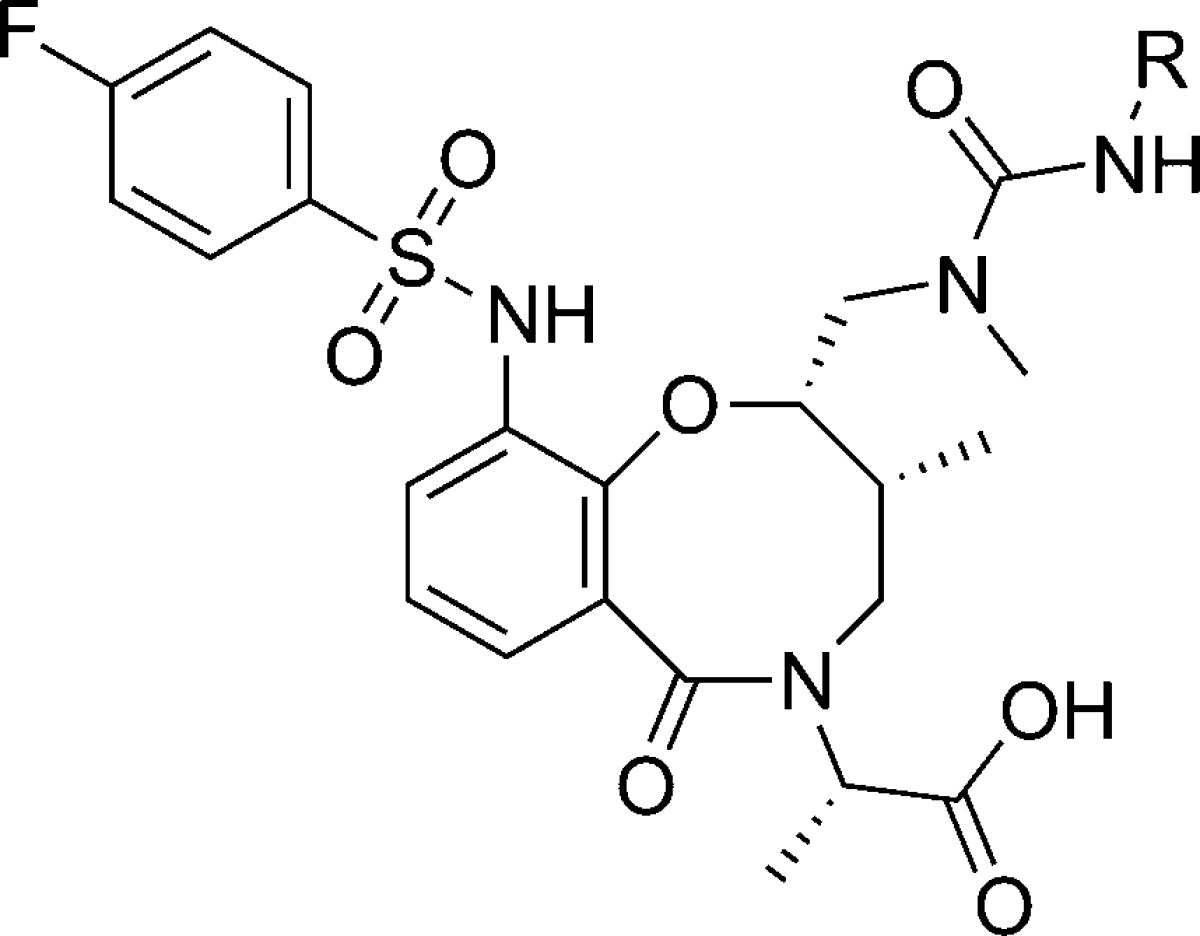
Table 1. Structure–Activity Relationship (SAR) on the Urea Domain of 7.

| compd | R | DSC ΔTm (°C)a | FP IC50 (μM)b |
|---|---|---|---|
| 7 | p-CF3C6H4 | 2.9 | 4.5 |
| 8 | m-CF3C6H4 | 0.2 | >25 |
| 9 | o-CF3C6H4 | 0.2 | >50 |
| 10 | Ph | 0.2 | >50 |
| 11 | p-MeOC6H4 | 0.2 | >50 |
| 12 | 1-Np | –0.1 | >50 |
| 13 | 2-Np | 0.8 | >25 |
Differential scanning calorimetry (DSC) assay: 250 μM compound and 25 μM MCL1 (173–329) in 25 mM Hepes, pH 7.4, 100 mM NaCl, 0.1 mM TCEP, and 4% DMSO.
FP assay: Serial dilutions of compound, with a top concentration of 50 μM, were preincubated for 30 min with 200 nM MCL1 and 25 nM TAMRA-Noxa in 25 mM Hepes, pH 7.4, 100 mM NaCl, 0.005% Tween 20, and 2% DMSO.
