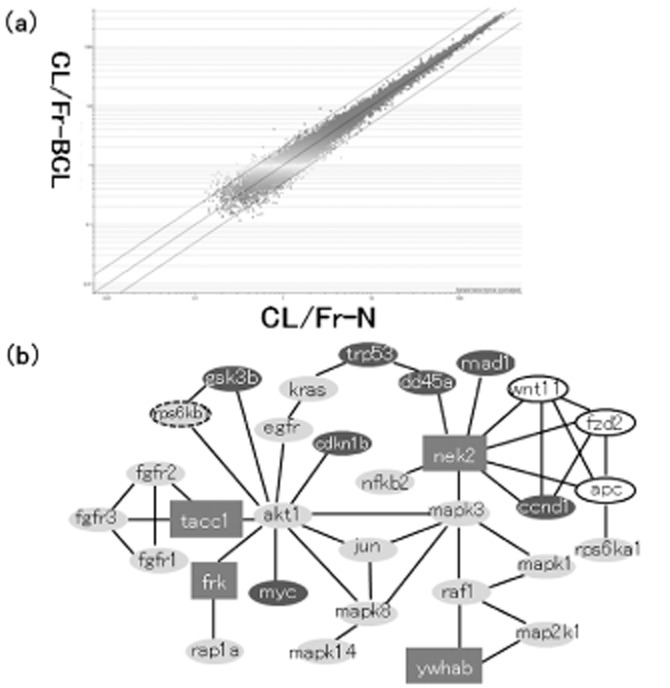
Figure 2.

Gene expression analysis between CL/Fr-BCL and CL/Fr-N fetuses. Differential expression between CL/Fr-BCL and CL/Fr-N fetuses (a). Each dot represents a signal intensity measurement for a gene. The lines represent the thresholds for two-fold differential expression. Gene network that associate cell proliferation in CL/Fr-BCL (b). The dataset was preprocessed by restricting the list to genes that were greater than two-fold or less than 0.5-fold in hybridization intensity.  , gene that showed 2-fold;
  , Candidate gen;
  , KEGG Cell cycle pathway;
  , KEGG MAPK pathway;
  , KEGG Wnt pathway;
  , KEGG Tgfb pathway.
