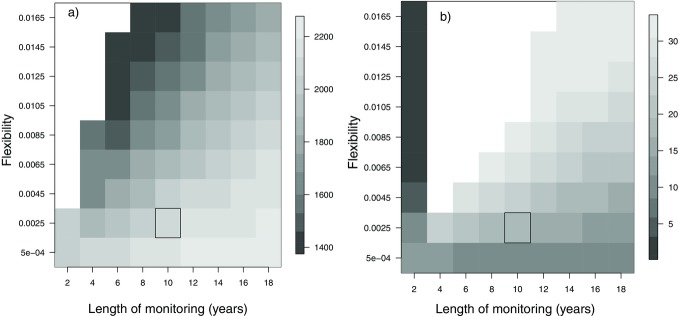
Figure 3.

The (a) population size (extinction risk <1% in all case, white area) and (b) quota of mountain nyala (average annual variation <5 nyala per year, white area) for a range of length of monitoring years and flexibility parameters (the magnitude by which the quota changes in relation to population change). The box indicates the values chosen that balance the number of years of monitoring data used and flexibility of decision making, taking into account the size of the quota, population size, extinction risk, and annual average variation (AAV) of the quota.
