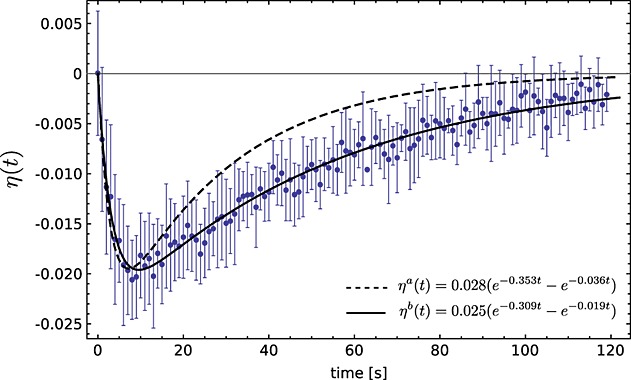
Figure 2.

Measured SPINOE effect curve for solvent protons (water) at 9.4 T following the addition of 20 mm [1,4-13C2]fumarate that had been hyperpolarized to 36% at the time of injection (n = 2). Error bars are the standard deviation on the mean. ηa(t) was calculated using eqn 20 and the experimental values shown in Table 1 (dashed line). ηb(t) is the best fit to the experimental data (solid line).
