Figure 3.

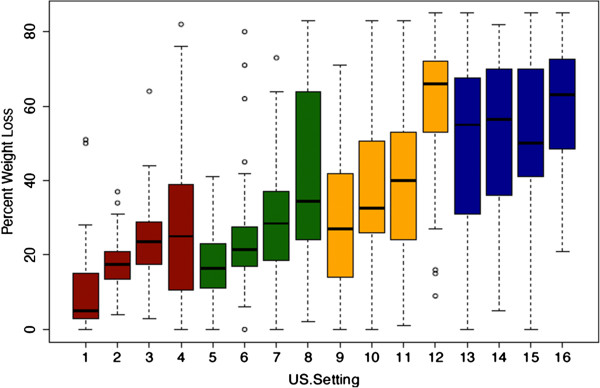
Histogram showing the percent clot weight loss for all 16 study groups. 5% DC (red bars), 10% DC (green bars), 20% DC (yellow bars), and 50% DC (blue bars).

Histogram showing the percent clot weight loss for all 16 study groups. 5% DC (red bars), 10% DC (green bars), 20% DC (yellow bars), and 50% DC (blue bars).