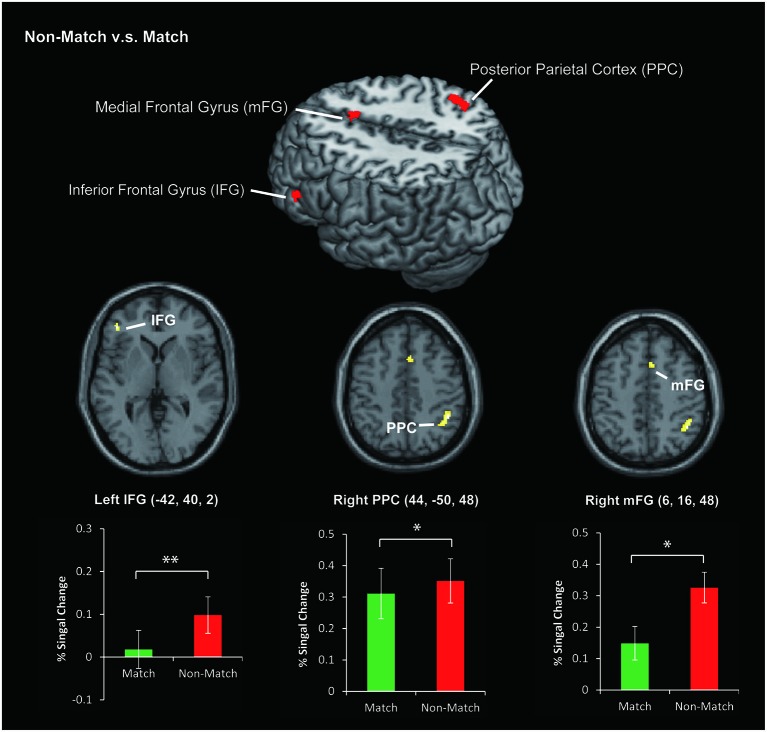
Figure 4.
The area of activation for Non-Match vs. Match. The colored bar graphs indicate the task-related activation (% Signal Change) of Non-Match vs. Rest and Match vs. Rest contrasts using a volume of interest with a sphere of 8 mm diameter. The centers of the spheres were the peak coordinates of activation. The error bars indicate the standard error of the mean. *P < 0.05, **P < 0.01.

