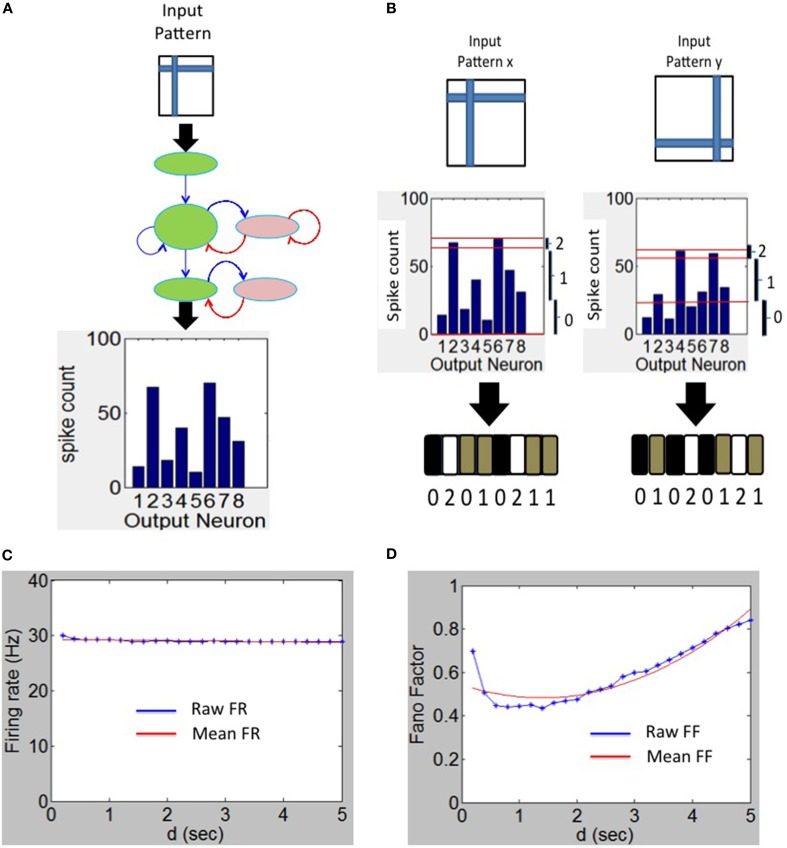
Figure 3.
Spike output decoding at the output layer of the network. (A) The output spike histogram is shown for neurons at the sink layer (assumed to have 8 neurons in this example) for a given input pattern presented at the source neurons and (B) this histogram is converted to firing rate code Sp with three possible states for each neuron (black—0 gray—1 and white—2). The firing rate code for two different input patterns results in two different codes as shown here. (C) The mean firing rate of the output neurons during the experiment to determine the duration d using the Fano Factor. (D) The variation of the Fano Factor as a function of the duration d.

