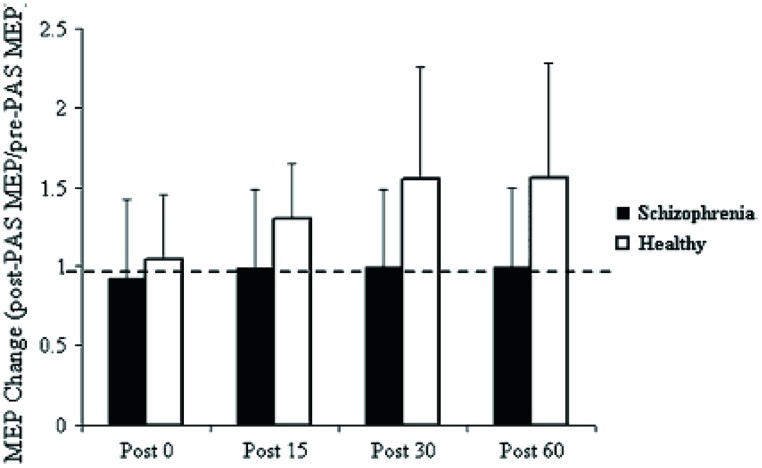
FIGURE 1.
Effect of PAS on MEP amplitude. Values represent a ratio of post-/pre-MEP amplitude. Values greater than 1 (dashed line) represent a PAS-induced MEP facilitation. Results demonstrate that patients with SCZ demonstrated no MEP facilitation (Frantseva et al., 2008).

