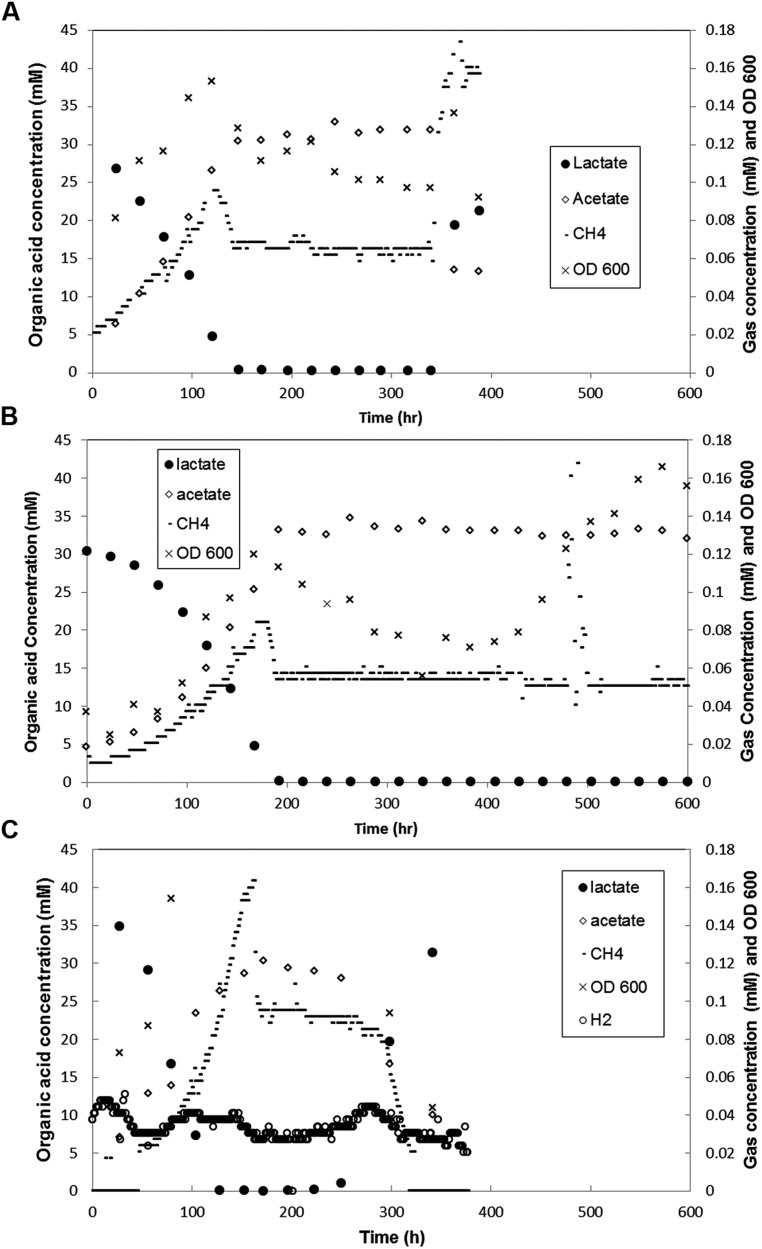
FIGURE 4.
Metabolite concentration over time in coculture biofilm reactors (A) with both biofilm and planktonic phases in which loading rate was increased at 341 h, (B) that had biofilm coupons removed at 432 h (C) grown with ΔpilA mutant D. vulgaris and wild-type M. maripaludis. Each graph is representative of one of two duplicate experiments.

