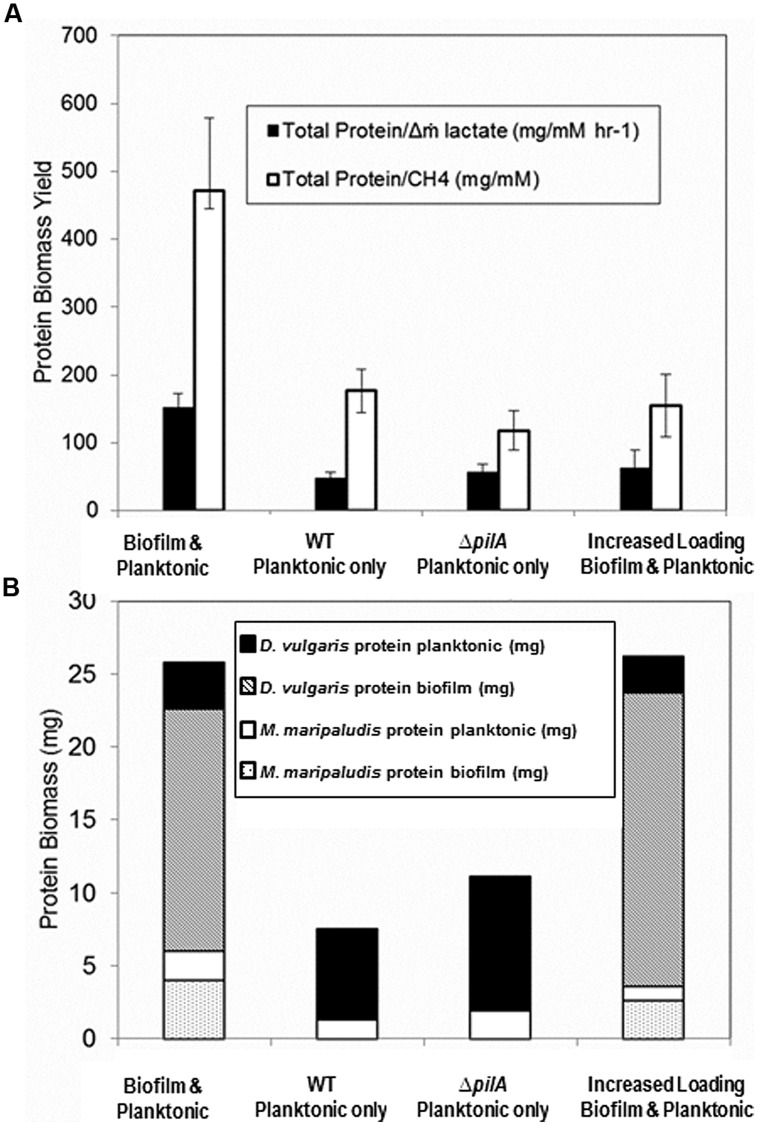
FIGURE 6.
(A) Biomass yield per lactate mass flux and per methane for reactors containing coculture with biofilm and planktonic phases (base case; n = 8), planktonic phase only after biofilm was removed (n = 14), ΔpilA mutant coculture planktonic phase only (n = 7), and both biofilm and planktonic phases at an increased loading rate (n = 2). Error bars represent 95% confidence interval. (B) Biomass distribution of each cell type in biofilm and planktonic phases for the same culture conditions based upon cell volume ratios and cell counts respectively. Unpaired two-tailed t-test results indicate total protein/Δm lactate difference is significant between coculture biofilm and planktonic (base case) versus all other conditions (p < 0.005), but that planktonic only versus increased loading rate is not significant (p = 0.4). Total Protein/CH4 unpaired two-tailed t-test results were significant between biofilm and planktonic (base case) versus all other conditions [versus WT planktonic and ΔpilA planktonic (p < 0.005), biofilm and planktonic (base case) versus increased loading rate (p = 0.05), planktonic only versus increased loading rate (p = 0.4)].

