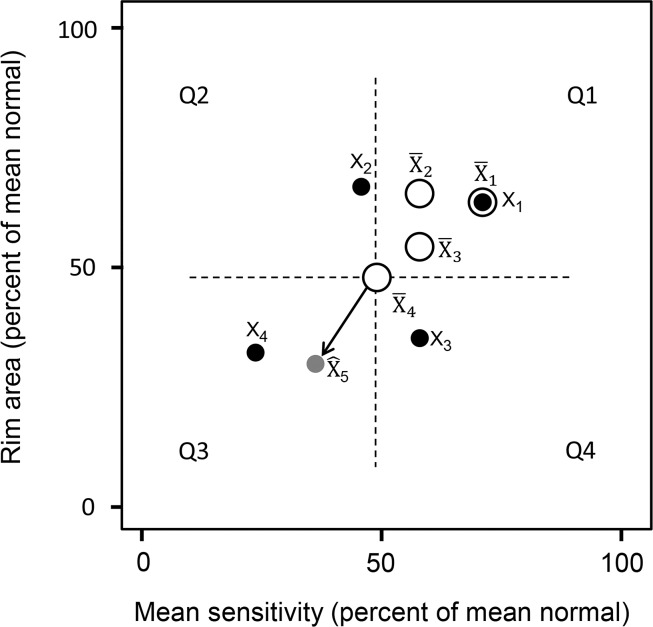
Figure 1.
An illustration of the dynamic structure–function (DSF) model is presented. Four longitudinal paired measurements of rim area and mean sensitivity for a subject (black solid circles, labeled from X1 to X4) are plotted in a two-dimensional space showing structural and functional values. Structural and functional measurements are expressed in percent of mean normal, which could be greater than 100% in an individual eye. In the DSF model, the centroid (empty circles, labeled from X̄1 to X̄4) is an estimate of the current stage of the disease. The velocity vector (arrow) describes the direction and rate at which structure and function are jointly changing over time. The velocity vector may point toward any of the four quadrants (labeled from Q1 to Q4 in counterclockwise order). Q1, observed improvement on both RA and MS; Q2, observed worsening of MS and improvement of RA; Q3, observed worsening in both RA and MS; Q4, observed worsening of RA and improvement of MS. Based on the last centroid X̄4 and an estimated velocity vector, the future state (gray solid circle labeled X̂5) can be predicted.

