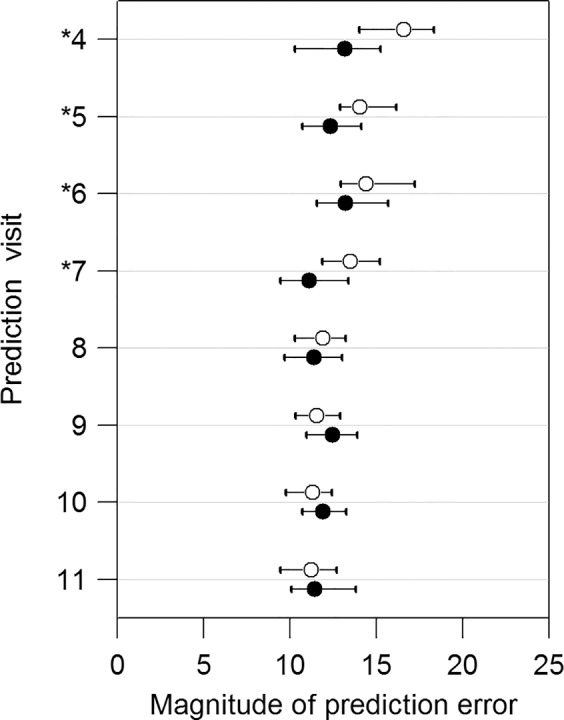
Figure 2.

Comparisons of prediction errors in predicting RA and MS for visit 4 to visit 11. The empty and solid circles represent the median PE with the OLSLR and the DSF model, respectively. The horizontal bars show the 95% confidence intervals for the median PE. The asterisks denote the significant differences between the OLSLR and the DSF model based on Wilcoxon signed-rank test.
