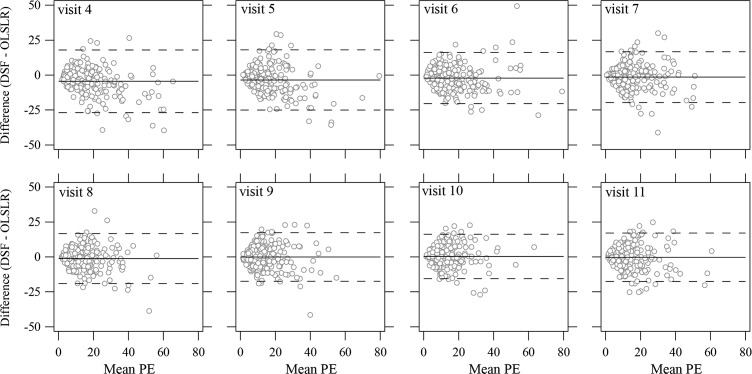
Figure 3.
Limits of agreement between the OLSLR and the DSF model on the prediction errors for visit 4 to visit 11. The horizontal axis shows the mean PE of the OLSLR and DSF model for each eye. The vertical axis shows the PE difference calculated by the DSF model minus the OLSLR model. The solid lines and the dashed lines represent the mean difference and corresponding 95% limits of agreement. Six eyes (four eyes with an absolute difference in PE larger than 50% of mean normal and two eyes with a mean PE larger than 80% of mean normal) are not shown for clarity, but they were used in the calculation of the limits of agreement.

