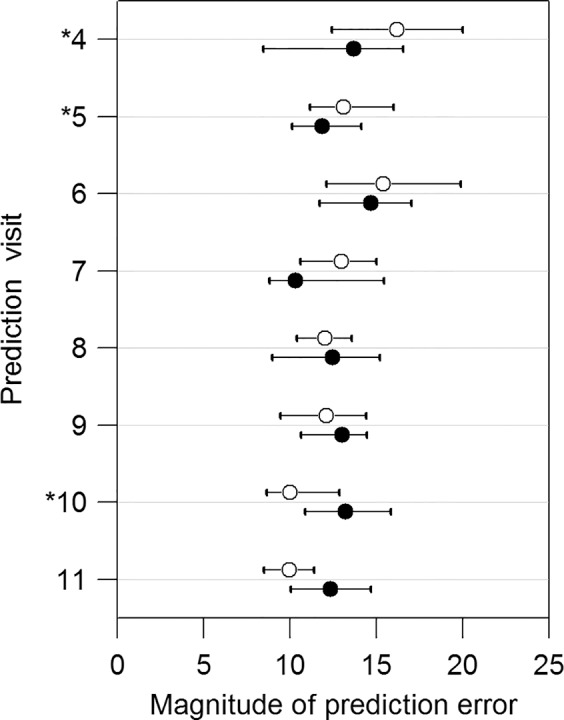
Figure 5.

Comparisons of prediction errors for visit 4 to visit 11 in the subset of 94 eyes that are progressing significantly according to OLSLR. The empty and solid circles represent the median PE with the OLSLR and the DSF model, respectively. The horizontal bars show the 95% confidence intervals for the median PE. The asterisks denote the significant differences between the OLSLR and the DSF model based on Wilcoxon signed-rank test.
