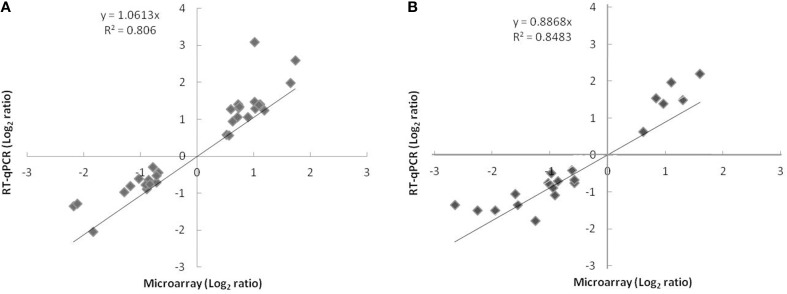
Figure 1.
Comparison of log2 expression ratios of 38 differentially regulated genes measured by using microarray and qPCR at t24h (A) or t72h (B). Positive and negative log2 expression ratios represent up- and down-regulation in the presence of nitrate and nitrite. Each data point is calculated from averages of biological triplicates.

