Figure 1.
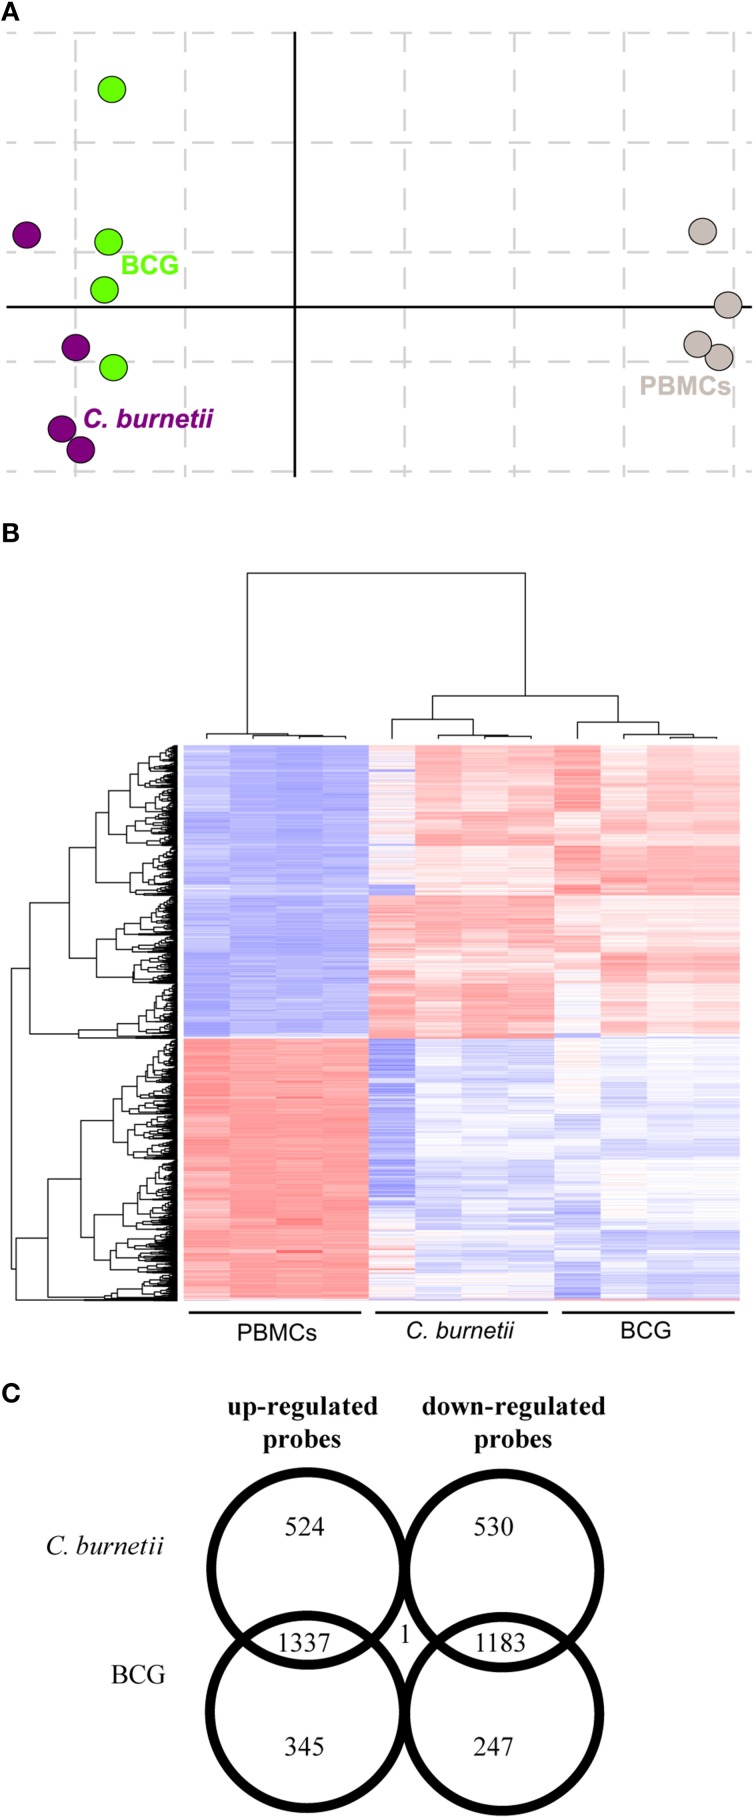
Transcriptional responses of granuloma cells. Granuloma cells and PBMCs were analyzed by microarray. (A) The correspondence analysis of the probeset signature revealed that C. burnetii and BCG-induced granulomas were clearly separated from PBMCs. (B) The hierarchical clustering analysis showed specific clusters of upmodulated and downmodulated probes in granuloma cells compared to PBMCs. Gene expression level is color-coded from blue (downregulation) to red (upregulation). (C) The Venn diagram represents the expression of upmodulated and downmodulated probes in C. burnetii and BCG granuloma compared with PBMCs. The numbers in overlapping regions indicate the number of probes commonly modulated in granuloma cells obtained in response to C. burnetii and BCG. The numbers in non-overlapping regions indicate the number of probes specifically modulated in response to C. burnetii or BCG.

