Figure 2.
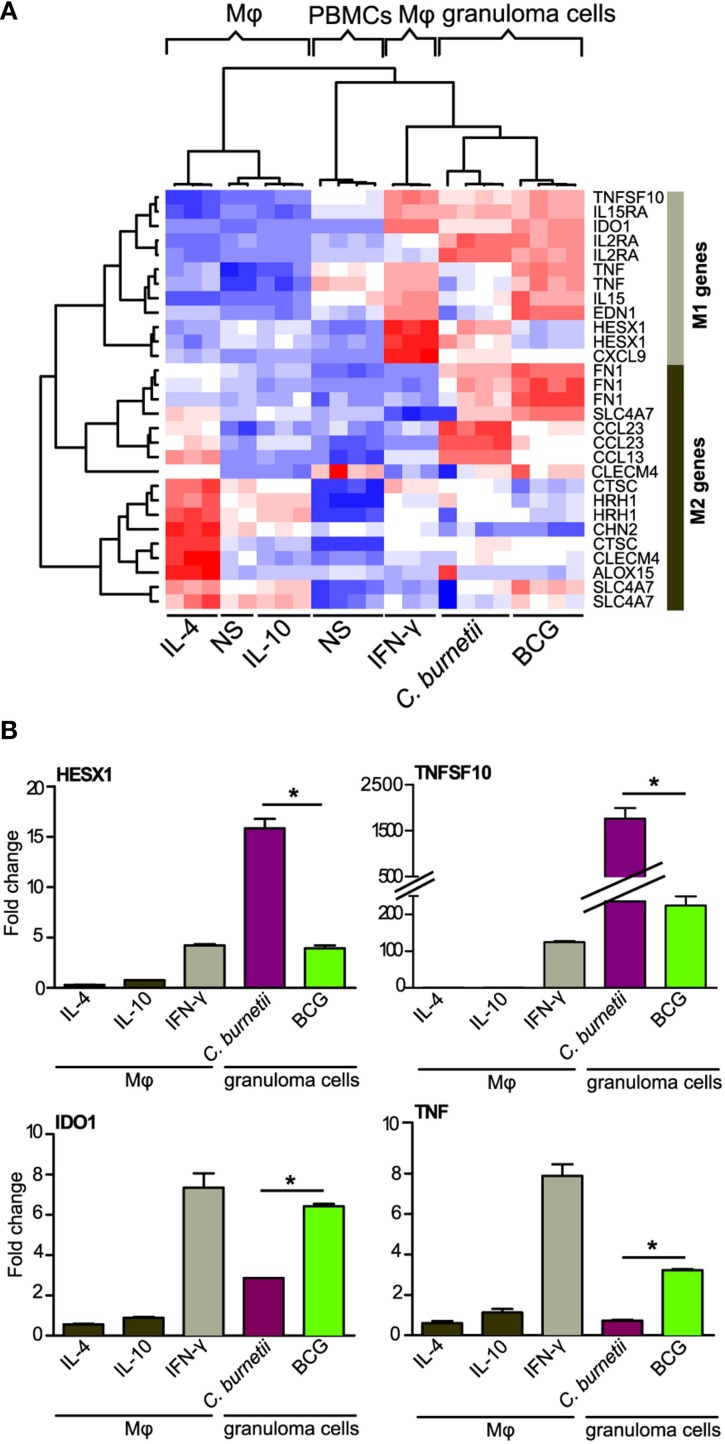
Atypical M1 polarization of granuloma cells. The M1/M2 polarization of granuloma cells was studied using macrophages stimulated with IFN-γ (M1), IL-10, IL-4 (M2) as controls of M1 and M2 polarization. Microarrays (A) and qRT-PCR (B) were performed on M1/M2 macrophages and granuloma cells. (A) The hierarchical clustering of specific markers of M1 or M2 polarization indicates that granuloma cells induced by C. burnetii and BCG were located within a unique cluster near M1 macrophages. Note that M2 genes were modulated in granuloma cells as well. Gene expression level is color-coded from blue (downregulation) to red (upregulation). (B) The expression of HESX1, TNFSF10, IDO1, and TNF (M1 genes) was increased in C. burnetii- and BCG-induced granulomas, but their expression was differentially modulated in both types of granulomas. *p < 0.05 for the comparison between C. burnetii and BCG using Mann-Whitney U-test. Mφ, Macrophages; NS, unstimulated.

