Figure 3.
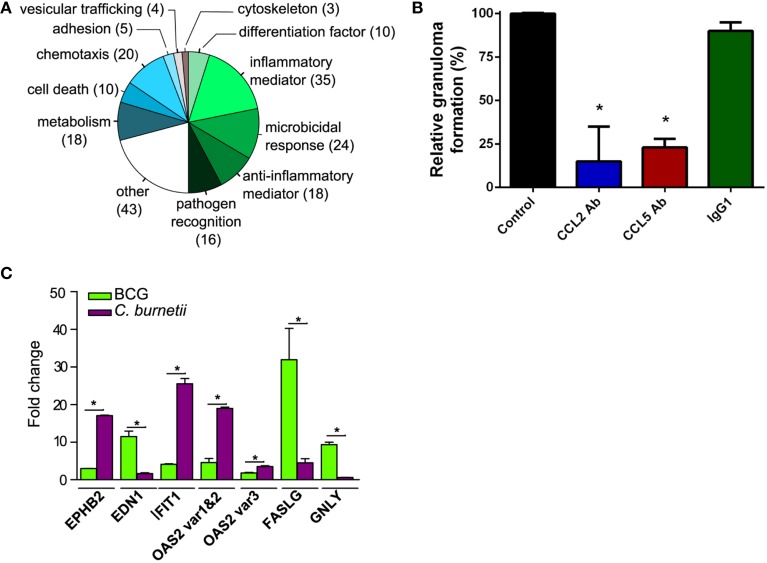
Genes related to immune response in granuloma cells. (A) The genes that were modulated in granulomas induced by C. burnetii compared with BCG-induced granulomas were manually classified according to functions previously reported in immune response. The pie chart represents the distribution of modulated genes in each biological group. (B) PBMCs were incubated with C. burnetii-coated beads in the presence of CCL2 Ab, CCL5 Ab, and IgG1 or in their absence (Control) and the formation of granulomas was measured. Results were expressed as relative granuloma formation. *p < 0.05 for the comparison of conditions with and without antibodies. (C) The expression of EPHB2, EDN1, IFIT1, OAS2, FASLG, and GNLY genes in granuloma cells was confirmed by qRT-PCR. *p < 0.05 for the comparison between C. burnetii and BCG using Mann-Whitney U-test.

