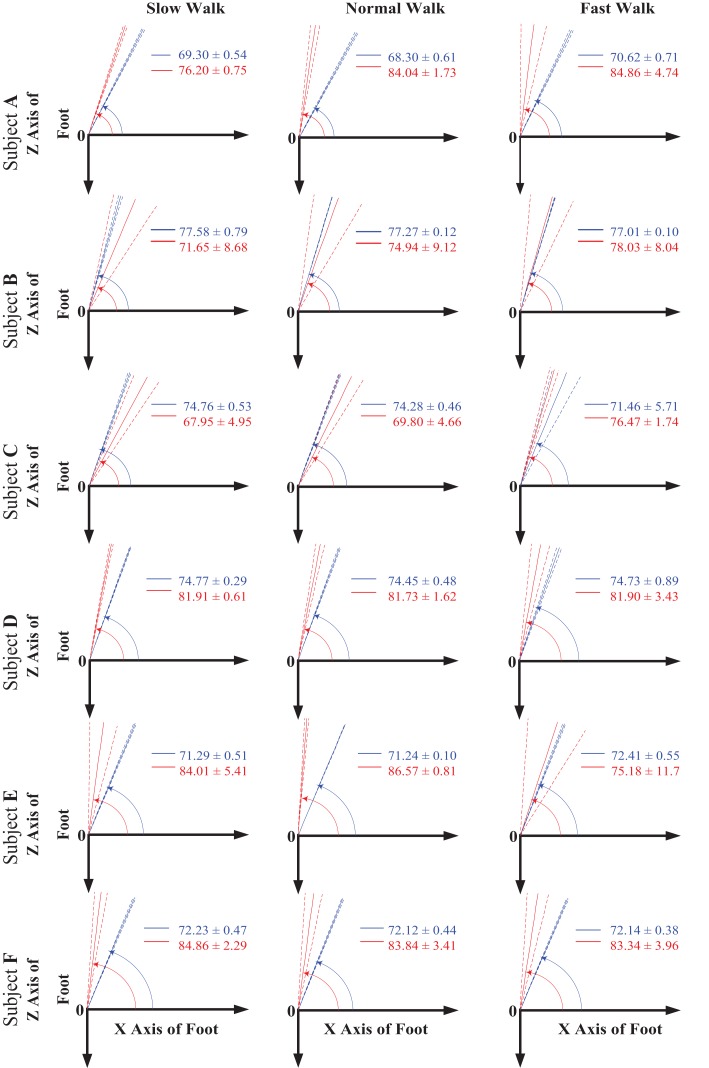
Figure 4.
The orientation angle α made by the functional axis (red) and anatomical axis (blue) with respect to the foot X axis when projected to the XOZ plane of the foot coordinate system for all the six subjects across all three walking speeds. The solid lines indicate the mean value of the angle, whereas the dash lines show the 1 SD zones.

