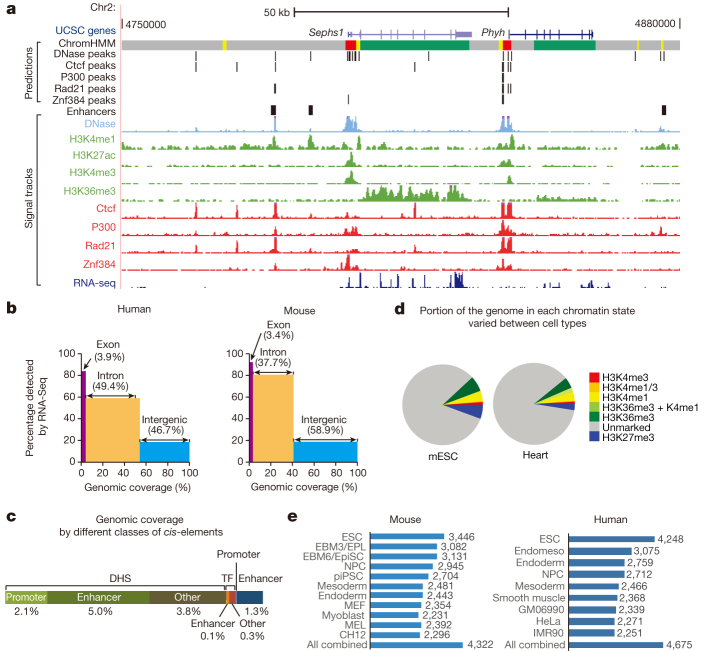
Figure 1. Overview of the mouse ENCODE data sets.
a, A genome browser snapshot shows the primary data and annotated sequence features in the mouse CH12 cells (Methods). b, Chart shows that much of the human and mouse genomes is transcribed in one or more cell and tissue samples. c, A bar chart shows the percentages of the mouse genome annotated as various types of cis-regulatory elements (Methods). DHS, DNase hypersensitive sites; TF, transcription factor. d, Pie charts show the fraction of the entire genome that is covered by each of the seven states in the mouse embryonic stem cells (mESC) and adult heart. e, Charts showing the number of replication timing (RT) boundaries in specific mouse and human cell types, and the total number of boundaries from all cell types combined. ESC, embryonic stem cell; endomeso, endomesoderm; NPC, neural precursor; GM06990, B lymphocyte; HeLa-S3, cervical carcinoma; IMR90, fetal lung fibroblast; EPL, early primitive ectoderm-like cell; EBM6/EpiSC, epiblast stem cell; piPSC, partially induced pluripotent stem cell; MEF, mouse embryonic fibroblast; MEL, murine erythroleukemia; CH12, B-cell lymphoma.

