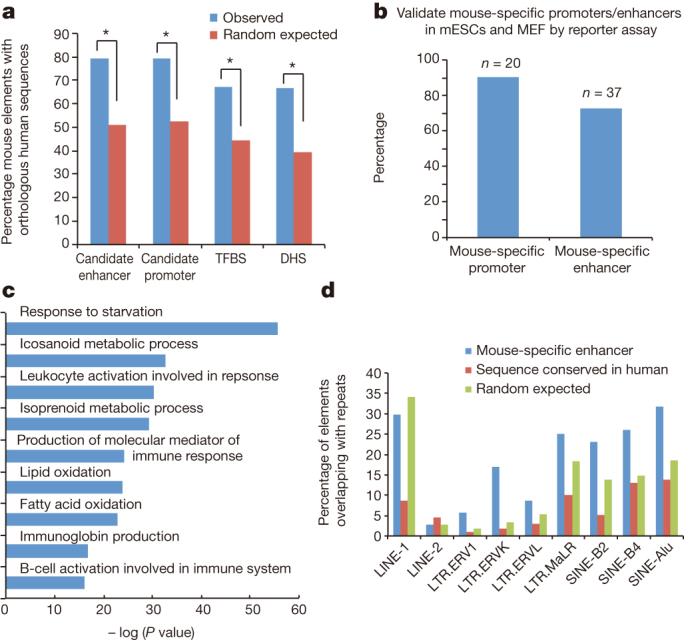
Figure 3. Comparative analysis of the cis-elements predicted in the human and mouse genome.

a, Chart shows the fractions of the predicted mouse cis-regulatory elements with homologous sequences in the human genome (Methods). TFBS, transcription factor binding site. b, A bar chart shows the fraction of the DNA fragments tested positive in the reporter assays performed either using mouse embryonic stem cells (mESCs) or mouse embryonic fibroblasts (MEF). c, A chart shows the gene ontology (GO) categories enriched near the predicted mouse-specific enhancers. d, A bar chart shows the percentage of the predicted mouse-specific enhancers containing various subclasses of LTR and SINE elements. As control, the predicted mouse cis elements with homologous sequences in the human genome or random genomic regions are included.
