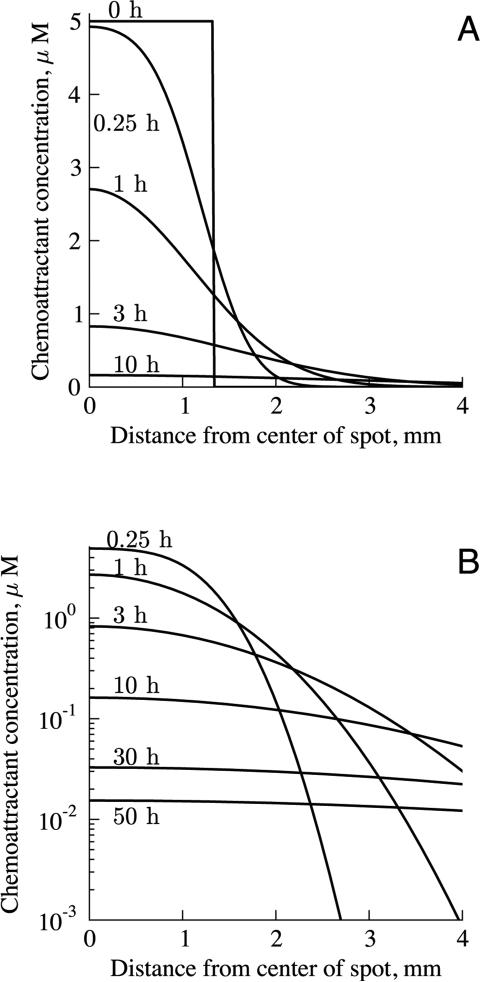
Figure 2.
Chemoattractant distribution inside and outside of the spot over time, with 5 μM EGF in the spot initially, on (A) linear and (B) logarithmic scales. The edge of the spot is at 1.3 mm. Initially, the chemoattractant distribution curve is sharp at the interface between the spot and the medium. Over time, the chemoattractant diffuses and the gradient flattens.

