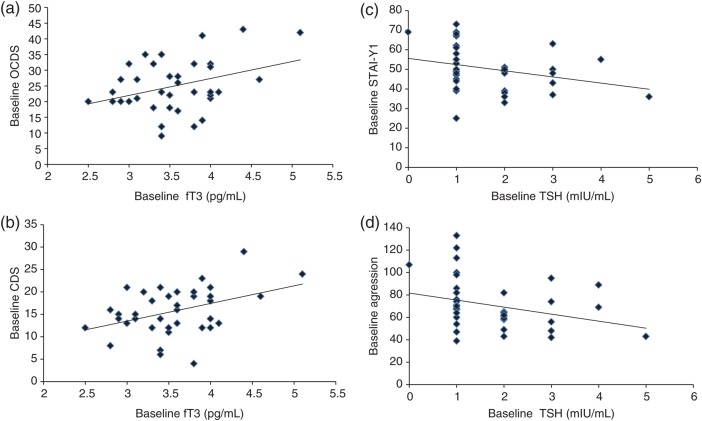
Fig. 1.
(a) Correlation scatter plot for baseline fT3 level and OCDS. At baseline, a significant positive correlation was found between fT3 and the OCDS total craving scale (r = 0.358, P = 0.029). (b) Correlation scatter plot for baseline fT3 level and CDS. At baseline, a significant positive correlation was found between fT3 and the CDS compulsive subscale (r = 0.405, P = 0.013). (c) Correlation scatter plot for baseline TSH level and STAI-Y1 score. At baseline, TSH levels were significantly and negatively correlated with the STAI-Y1 state anxiety score (r = −0.342, P = 0.031). (d) Correlation scatter plot for baseline TSH level and the aggression score. At baseline, TSH levels were significantly and negatively correlated with the AQ aggression score (r = −0.35, P = 0.027).

