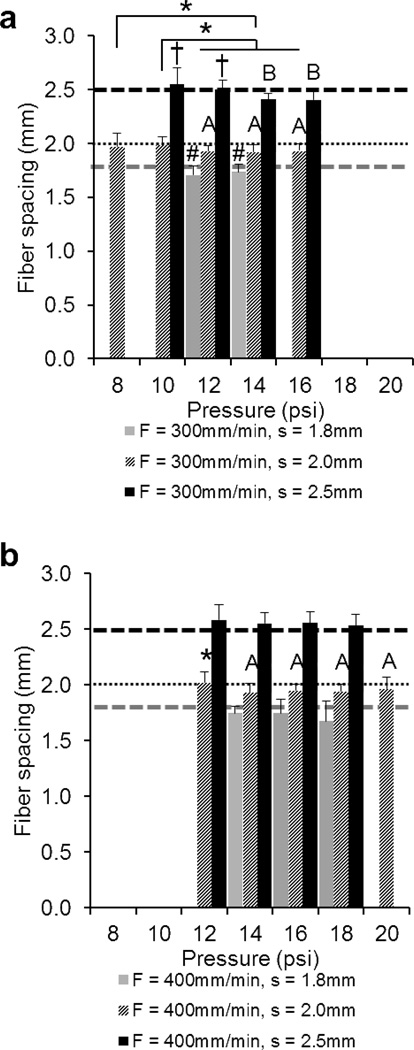
Figure 6.
Comparison of the fiber spacings of 3DP scaffolds printed at a) F = 300mm/min and b) 400mm/min. The data represent means of four samples with the error bars representing the standard deviations. One-way ANOVA was used to determine significant differences within each F/s combination (p < 0.05). Significance in (#) s = 1.8 group, (*) s = 2.0 group, (†) s = 2.5 group. A–B Values marked with same letter do not differ. Note: It was not possible to print all F/s combinations at P = 8, 10, 12, 16, 18, 20psi (where bars are absent).

