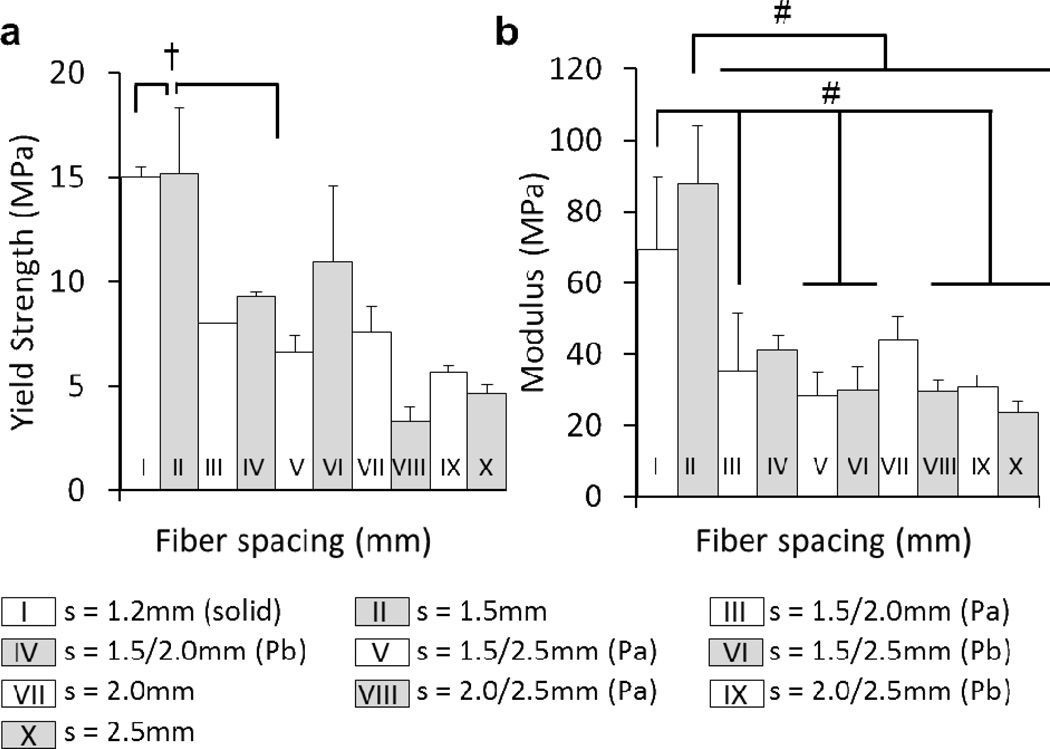
Figure 8.
Compressive testing a) yield strength, b) modulus, of porous 3DP scaffolds (uniform and gradient) printed at F = 400mm/min, P = 16psi. (solid) indicates a fiber spacing that produces 0% theoretical porosity at the given F and p values. Groups with dashed lines are printed in the same manner as their solid counterpart. (Pa) Scaffold was tested with smaller pore size on bottom. (Pb) Scaffold was tested with smaller pore size on top. † and # indicate statistical significance (p < 0.05, n = 3) within compressive yield strength and modulus values, respectively.

