Figure 2.

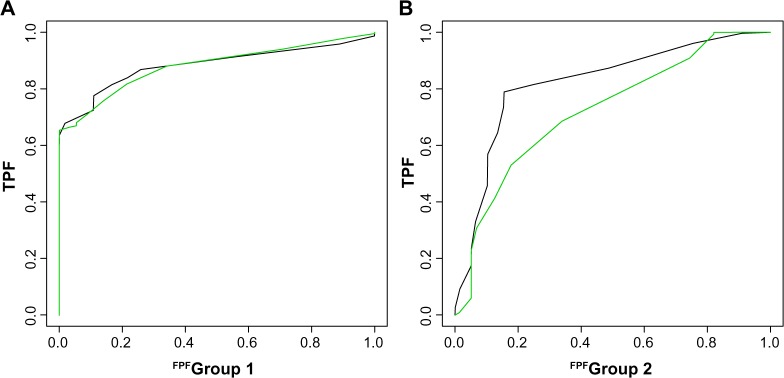
ROC curves for a simulated data set. The green and black curves represent the operating characteristics of the differential graph model and the independent graph model, respectively.

ROC curves for a simulated data set. The green and black curves represent the operating characteristics of the differential graph model and the independent graph model, respectively.