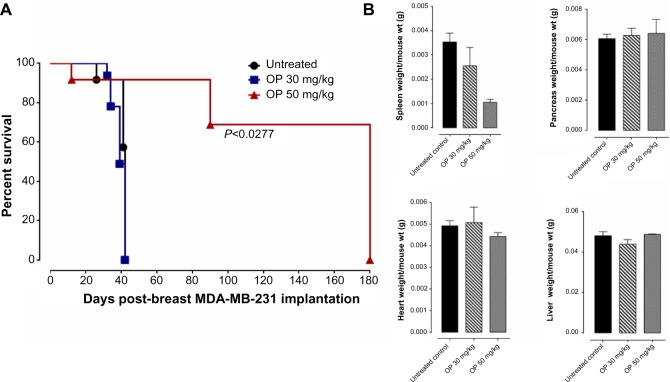
Figure 5.
(A) Percent survival of indicated cohorts of mice taken from Figure 4D and (B) mean ± SEM of live necropsy spleen, pancreas, heart, and liver weight per mouse body weight for each of the cohorts in Figure 4.
Note: Statistical analysis was performed using the Log-rank (Mantel–Cox) test.
Abbreviations: OP, oseltamivir phosphate; SEM, standard error of the mean.

