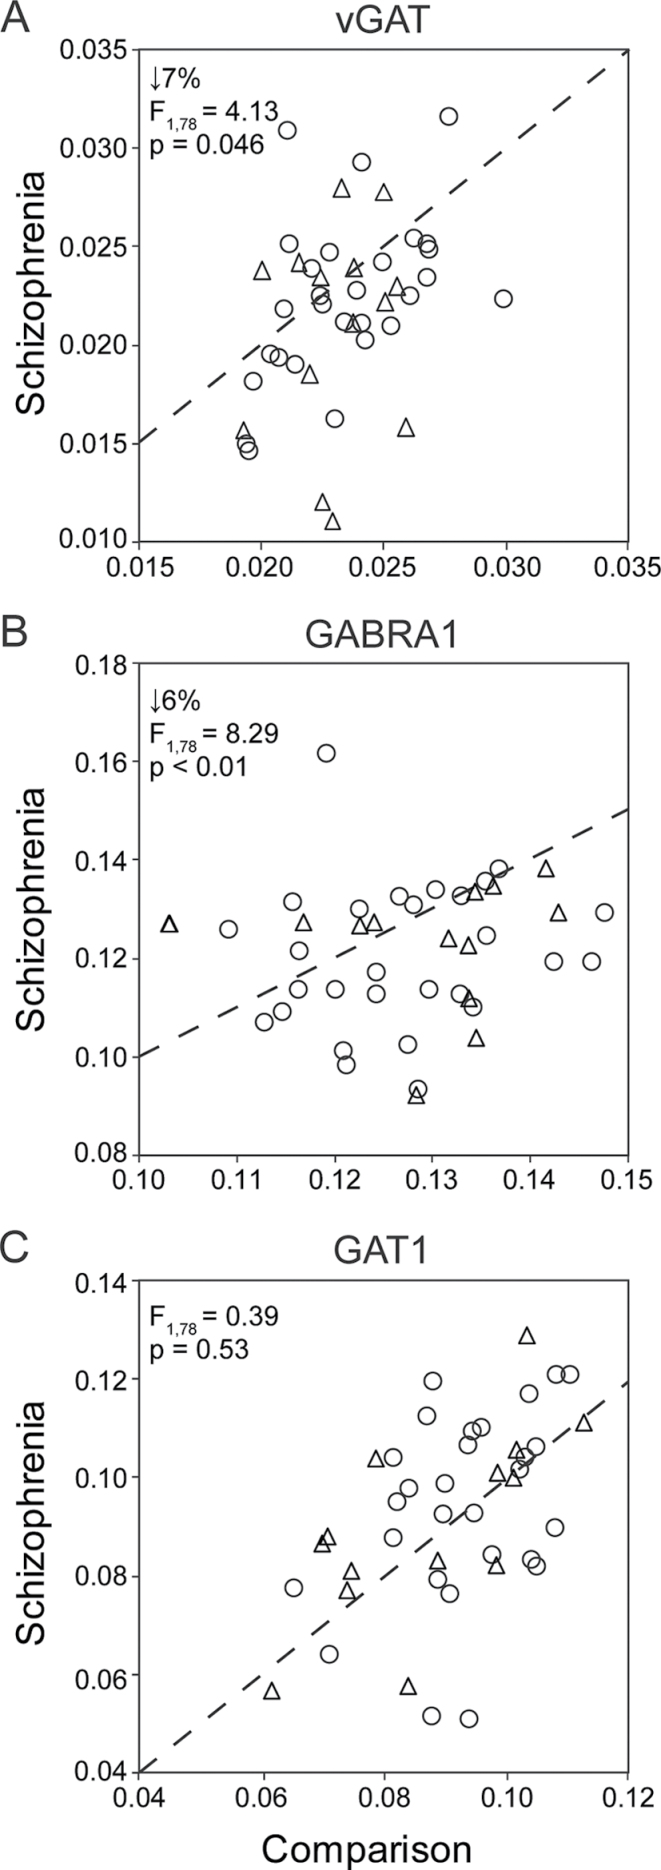
Fig. 1.
Vesicular GABA transporter (vGAT) (A), GABAA receptor subunit α1 (GABRA1) (B), and GABA membrane transporter (GAT1) (C) messenger RNA levels in prefrontal cortex from schizophrenia and comparison subjects. Scatter plots show the transcript levels for each matched pair of a comparison and either a schizophrenia (open circles) or schizoaffective disorder subject (open triangles). Values below the dashed unity line reflect pairs in which transcript levels are lower in the schizophrenia (or schizoaffective) subject relative to the comparison subject.

