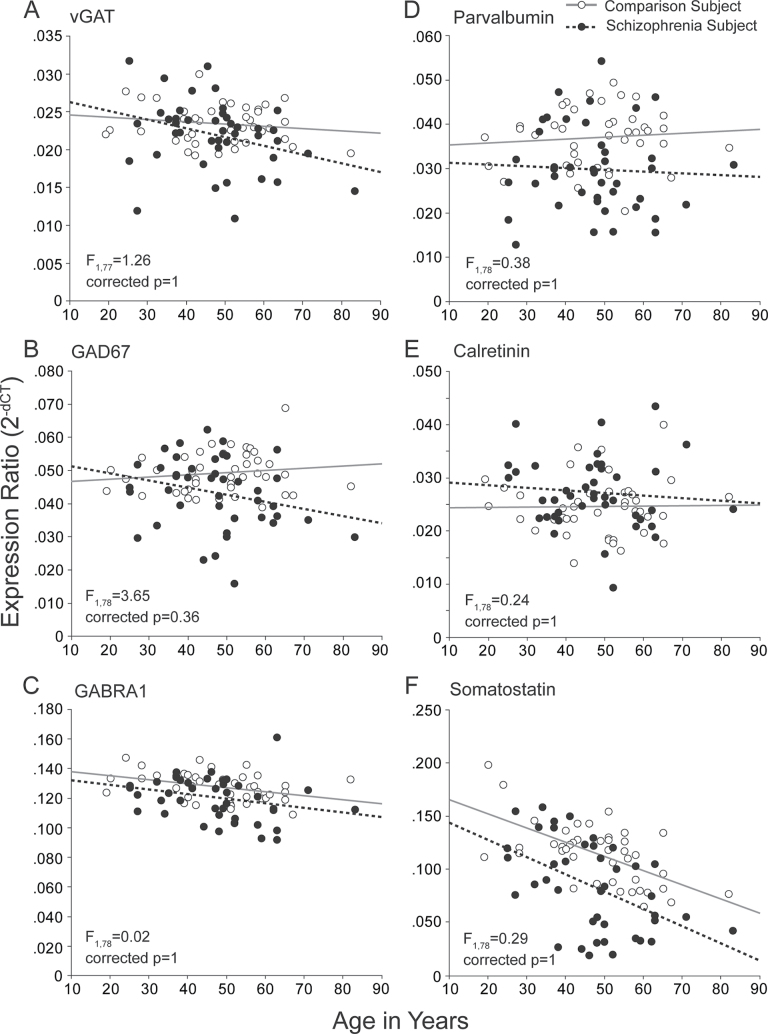
Fig. 3.
Interaction of age by diagnosis on GABA-related messenger RNA levels in the prefrontal cortex of schizophrenia subjects. For each panel, comparison subjects are shown in open circles and schizophrenia subjects in filled circles. Gray solid and black dashed lines indicate lines of best fit for comparison and schizophrenia subjects, respectively. F- and Bonferroni-Holm adjusted P values represent the age by diagnosis interaction statistics.

