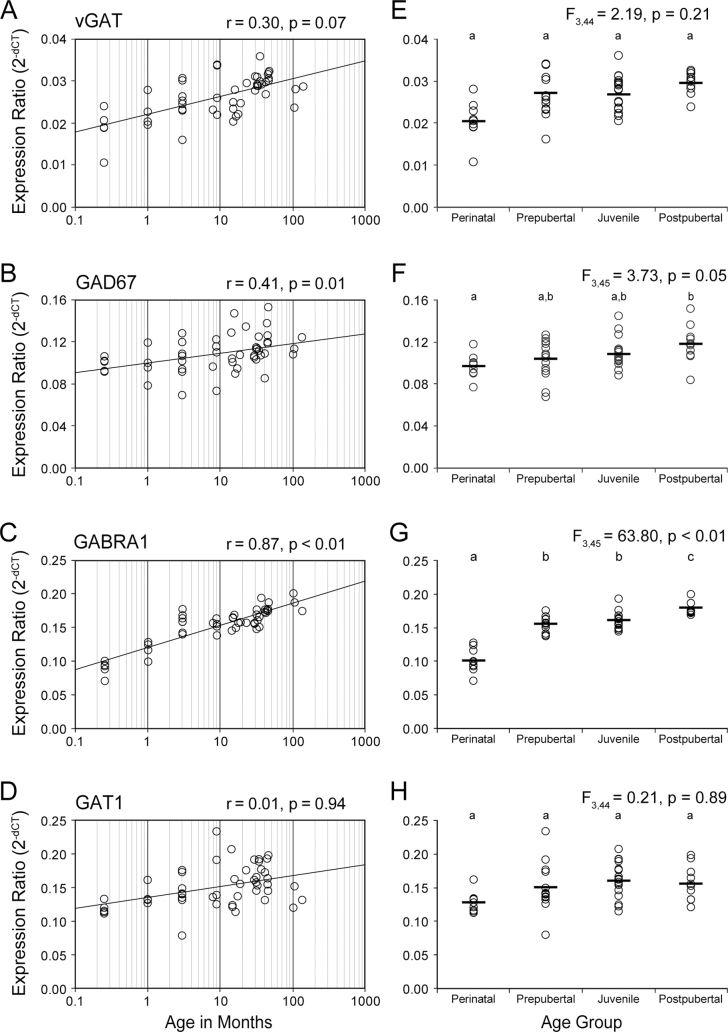
Fig. 4.
Postnatal developmental trajectories of transcripts regulating GABA neurotransmission in monkey prefrontal cortex. For panels A–D, the black line indicates least squares line of best fit; and Pearson’s correlation coefficient (r) and corresponding Bonferroni-Holm adjusted P value are indicated for each panel. For panels E–H, the black bars indicate group means. Age groups that do not share the same letters are significantly different (Bonferroni-Holm adjusted P < .05).

