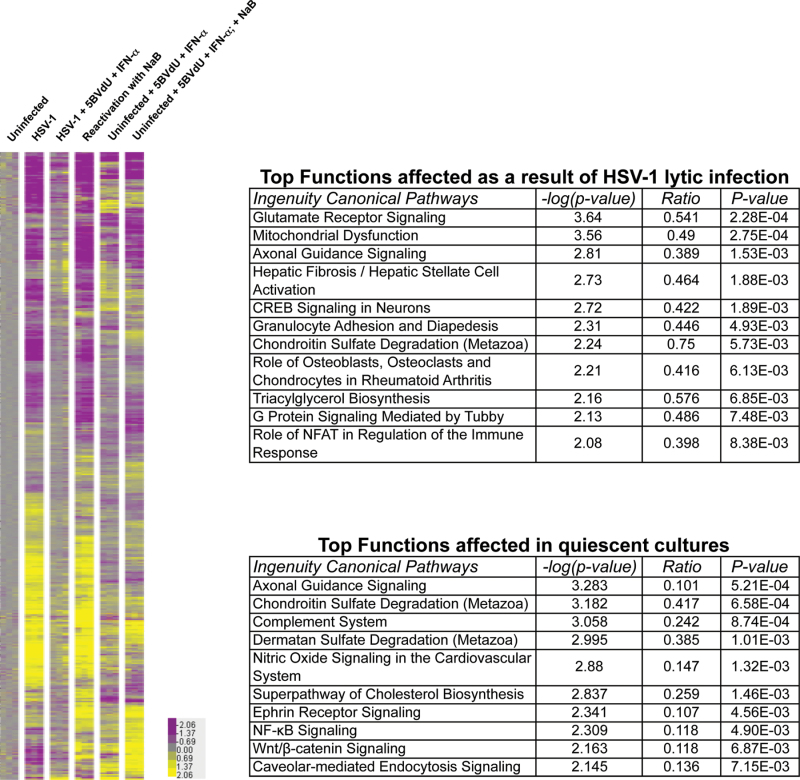
Fig. 3.
Gene expression analysis in acutely and quiescently infected neurons. The heat map represents statistically significant (P ≤ .05), differentially expressed genes after one-way ANOVA analysis and Benjamini-Hochberg correction applied. Columns represent individual samples (each group n = 3); selected genes are represented in rows. Upregulated genes are shown in yellow, and downregulated genes are shown in purple. Right: Ingenuity Pathways Analysis of acutely and quiescently infected neuronal cultures. For a color version, see this figure online.

