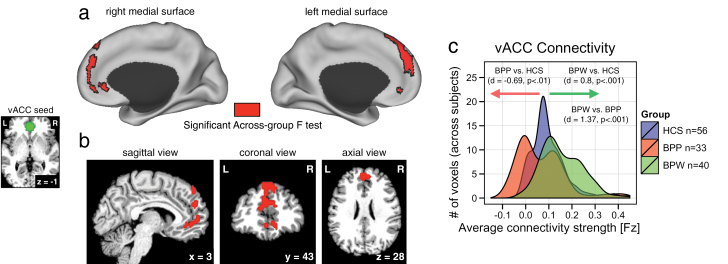
Fig. 1.
Alterations in vACC connectivity in bipolar illness with and without psychosis history. Red foci mark regions that showed a significant 1-way between-group ANOVA displayed on the surface (a) and in a volume view (b) to allow complete visualization of the cluster extent. As evident from the map, a large portion of superior medial cortex showed a significant between-group effect in vACC functional connectivity. The small panel on the left illustrates the vACC seed location (x = 2, y = 37, z = −1), which was selected based on our prior data-driven findings19 (see Materials and Methods). (c) The distributions of average connection strengths for each voxel showing a significant between-group effect are plotted for each individual group. The X-axis refers to the strength of connectivity effect in the identified region (using Fisher’s Fz values). The Y-axis quantifies the voxel count at a given strength of connectivity across groups (as opposed to individual subjects). Effect sizes (Cohen’s d) were calculated across subjects using the average signal across the entire cluster in panel (a), verifying marked alterations in vACC seed connectivity across groups (for complete pair-wise P and t values see table 2). The effect was largely driven by a reduction in vACC connectivity for bipolar patients with psychosis history (BPP) group (red distribution), whereas the bipolar patients without psychosis history (BPW) group showed increased vACC connectivity (green distribution) relative to healthy control subjects (HCS; blue distribution). Note: The frequency histograms are shown to illustrate the underlying nature (ie, directionality) of the group effects, not to quantify the difference (which is obligated by the voxel selection).

