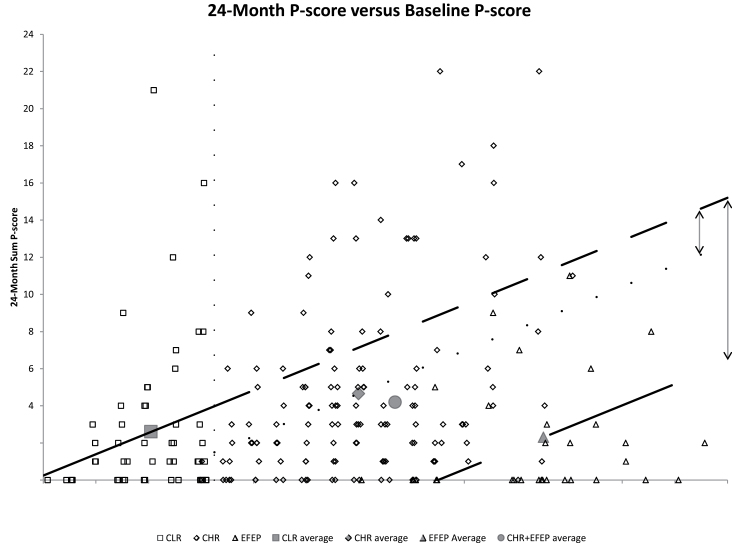
Fig. 2.
Regression-discontinuity outcome. CLR vs CHR (small arrow), p = .0034. CLR vs EFEP (large arrow), p < .0001. Dashed line extending from solid line represents expected regression outcome in the range of CHR and EFEP baseline values, based on CLR values. Regression lines are plotted through group averages with parallel slopes estimated from the primary analysis model. Vertical arrow lengths approximate effect sizes. CHR, clinically higher risk; CLR, clinically lower risk; EFEP, early first-episode psychosis.

