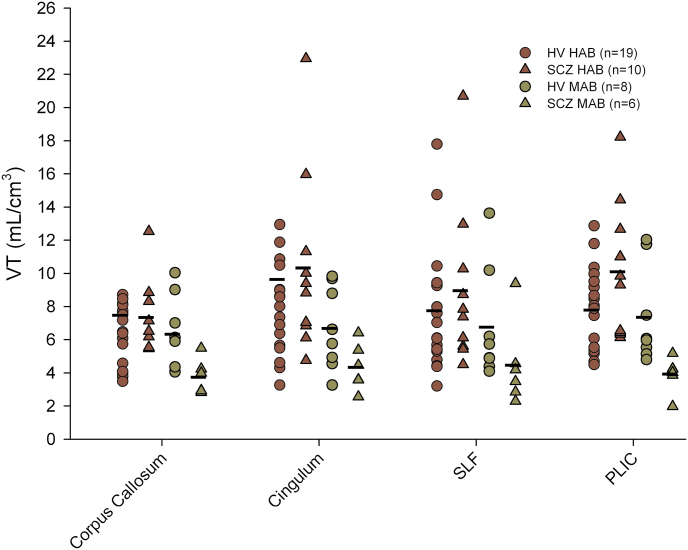
Fig. 2.
Total volumes of distribution (V T) of [18F]-FEPPA measured in white matter tracts, with TAC derived from the ROI analysis on corpus callosum, cingulum bundle, superior longitudinal fasciculus (SLF), and the posterior limb of the internal capsule (PLIC). No difference was observed between the clinical groups when considering V T values measured in the white matter tracts (F (1,38) = 0.597, P = .445). [18F]-FEPPA, N-acetyl-N-(2-[18F]fluoroethoxybenzyl)-2-phenoxy-5-pyridinamine; ROI, regions of interest; TAC, time-activity curve.

