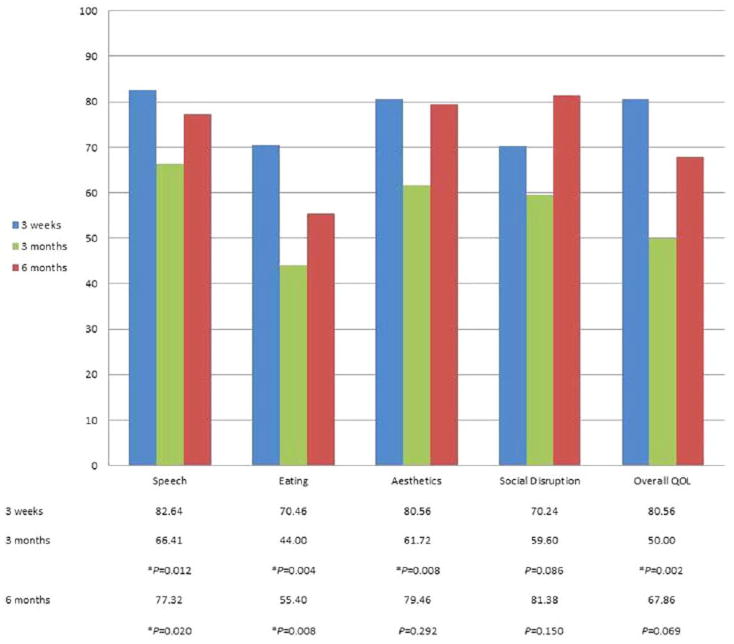
Fig. 2.
Comparison of 3-week quality of life scores with 3 and 6-month scores. *Statistically significant compared to matching 3-week score (P <.05). QOL = quality of life. [Color figure can be viewed in the online issue, which is available at www.laryngoscope.com.]

