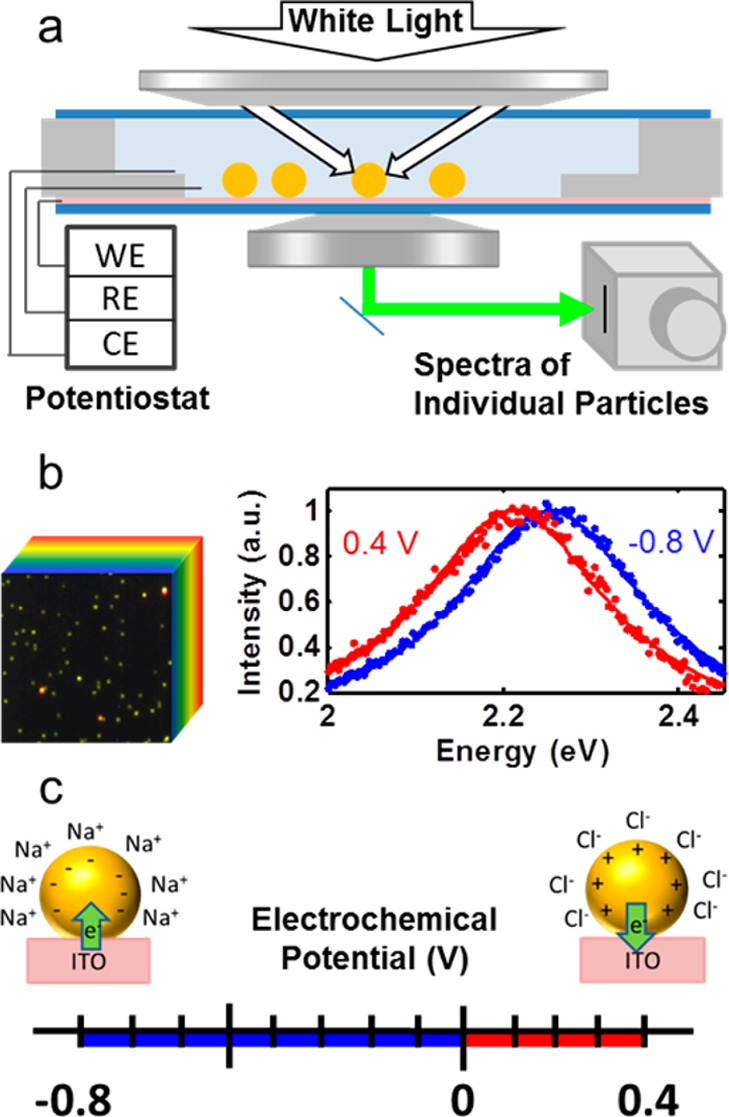
Figure 1.

Cathodic and anodic spectroelectrochemistry of single gold nanoparticles. (a) Optically transparent thin electrochemical cell for dark-field spectroscopy of single 50 nm gold spheres on an ITO working electrode (WE) under electrochemical potential with auxiliary and reference electrodes (AE, RE) composed of silver wires. (b, left) Steady-state hyperspectral imaging of many single nanoparticles under potential control (32 × 32 μm). (b, right) Normalized spectra at potential vertices for a single nanoparticle along with Lorentzian fits. (c) Non-Faradaic cathodic (blue) and anodic (red) potential ranges with predicted charging mechanisms shown schematically.
