Figure 2.

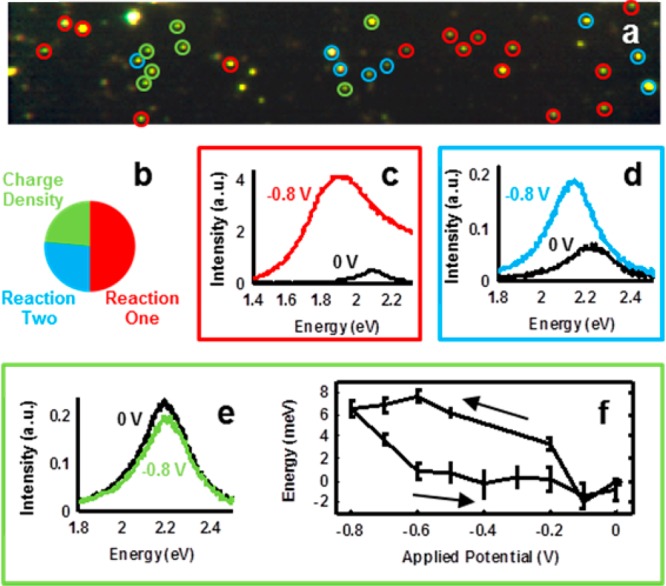
Cathodic hyperspectral steady-state electrochemical tuning of gold nanoparticles on ITO support. (a) Real-color RGB image of 50 nm gold nanoparticles at open-circuit potential. Nanoparticles that did not exhibit a Lorentzian scattering spectrum were not classified. Image size: 90 × 17 μm. (b) Classification of single-particle behavior based on the reversibility of potential-dependent spectral changes. (c) Scattering spectra at potential vertices for a single nanoparticle from subgroup Reaction One. (d) Spectra for a nanoparticle from subgroup Reaction Two. (e) Spectra for a nanoparticle showing charge density tuning of the plasmon resonance. (f) Mean peak resonance shift and associated standard error for seven nanoparticles exhibiting charge density tuning, shown as a function of applied potential. Arrows indicate applied potential scan directions.
