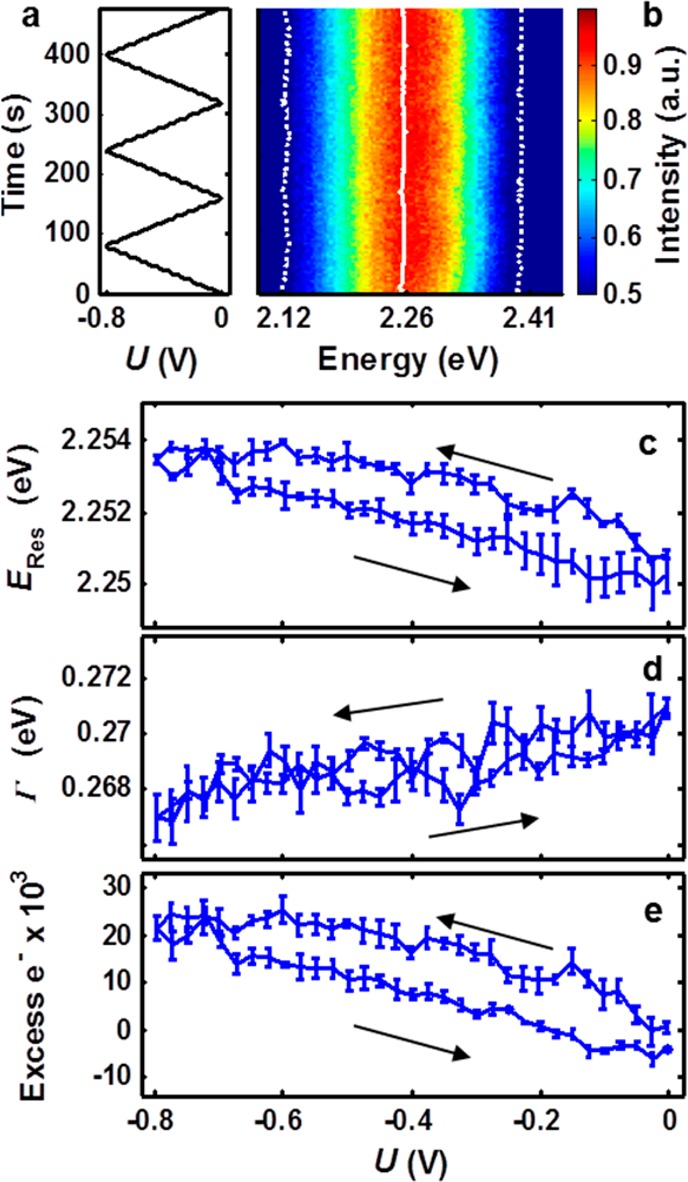
Figure 3.

Single-particle measurement of dynamic electrochemical tuning in the cathodic range (0 to −800 mV). (a) Electrochemical potential of the working electrode relative to the reference electrode as a function of time. Sweep rate: 10 mV/s. (b) Scattering spectra under dynamic potential control. The fitted resonance energy, ERes (solid white line), and full width at half-maximum, Γ (dotted white lines), are superimposed. (c) Reversible, cyclic ERes response as a function of potential U shown as mean with standard error for three consecutive cycles. (d) Average Γ over three cycles as a function of potential. (e) Mie–Drude model simulations, and the number of electrons transferred from the conductive substrate to the nanoparticle is calculated. Error bars indicate propagated standard error in ERes. Arrows indicate the scanning directions of the applied potential.
