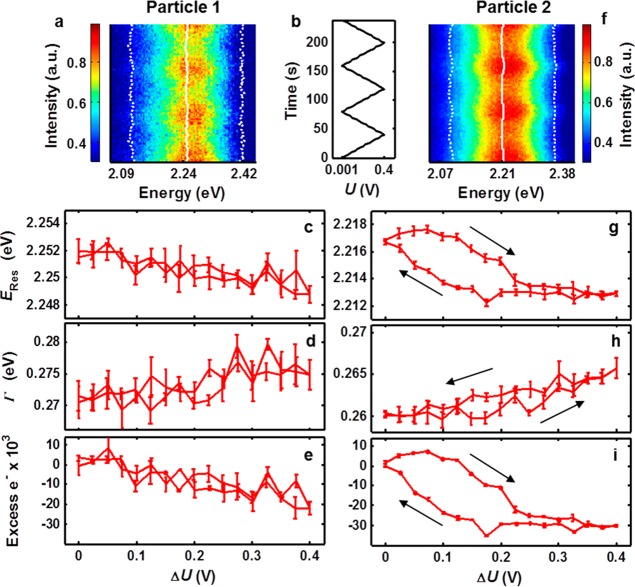
Figure 4.
Two distinct plasmonic responses to anodic charging. (a,f) Scattering spectra collected during dynamic potential control shown with ERes and Γ superimposed with solid and dashed white lines, respectively. (b) Electrochemical potential of the working electrode as a function of time. Sweep rate: 10 mV/s. (c,g) Average ERes over three consecutive cycles shown as a function of potential. (d,h) Average Γ is shown as a function of potential. (e,i) The number of electrons transferred from the nanoparticle to the substrate is shown as a function of potential, calculated using the Mie–Drude model scattering simulations and ERes. Error bars indicate propagated standard error in ERes.

