
Figure 3.
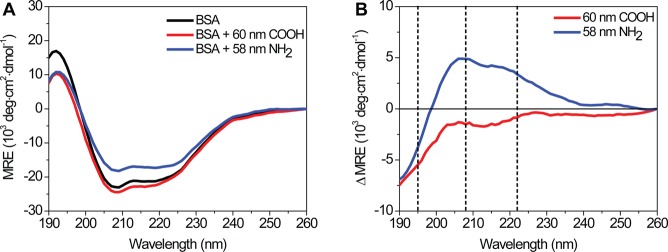
CD spectra of BSA in the presence of 60 nm carboxylate-modified NPs (red), 58 nm amine-modified NPs (blue), and in the absence of NPs (black). Spectra, in units of mean residue ellipticity (MRE), are the average of 10 consecutive scans. (A) Raw CD spectra. (B) CD difference spectra were calculated by subtracting the spectrum of BSA from BSA in the presence of 60 nm carboxylate-modified (red) or 58 nm amine-modified NPs (blue). Black dashed lines correspond to spectral peaks at 195, 208, and 222 nm. Similar results were obtained for 200 nm NPs (Figure S5 of the Supporting Information).