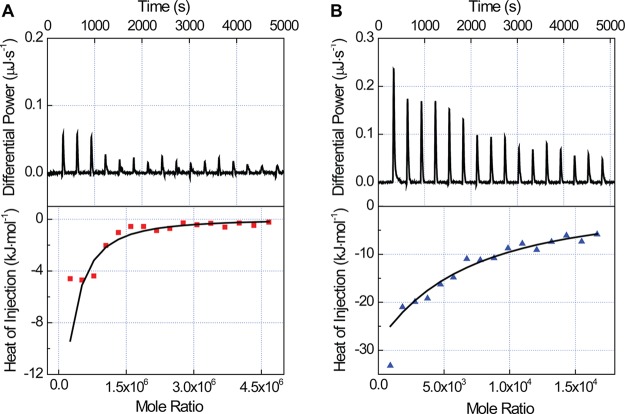
Figure 4.
Isothermal titration calorimetry (ITC) plots of differential power throughout the titration (top) and integrated heat as a function of the mole ratio of BSA adsorbed on NPs (bottom). The heat of dilution of BSA into buffer (Figure S6 of the Supporting Information) was subtracted for each injection from the heat of BSA titrated into a NP solution. (A) BSA titrated into a solution of 60 nm carboxylate-modified NPs. (B) BSA titrated into a solution of 58 nm amine-modified NPs. Raw data plotted in the TA Instruments software, NanoAnalyze, is shown in Figure S7 of the Supporting Information.

