
Figure 5.
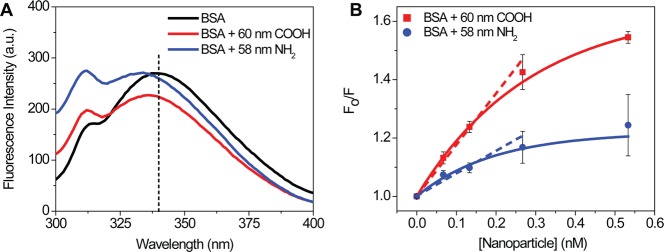
(A) Raw fluorescence spectra of BSA in the presence of 60 nm carboxylate-modified NPs (red), 58 nm amine-modified NPs (blue), and in the absence of NPs (black). The black dashed line at 340 nm corresponds to the emission from tryptophan residues in BSA. (B) Stern–Volmer plot of BSA quenching in the presence of increasing concentrations of NPs. The contribution from NPs alone and buffer were subtracted, and initial emission at 250 nm was set to zero. The solid lines correspond to an exponential fit of the raw data. Dashed lines are the initial slope used to calculate an effective equilibrium constant (eq 3).