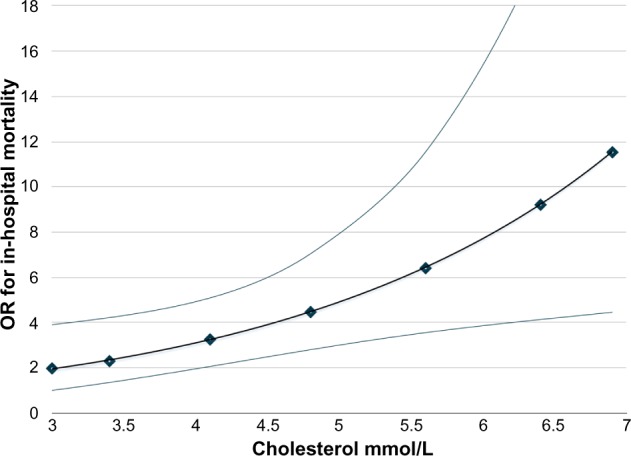
Figure 3.

Adjusted odds ratio (OR) of in-hospital mortality for patients 80 years old and older vs those younger than 80 years in relation to total cholesterol levels, controlling for smoking habits and for the median level of serum creatinine (84 μmol/L).
Notes: OR curve with 95% confidence interval lower and upper bound. Points represent, from left to right, 5th, 10th, 25th, 50th, 75th, 90th, and 95th percentiles.
