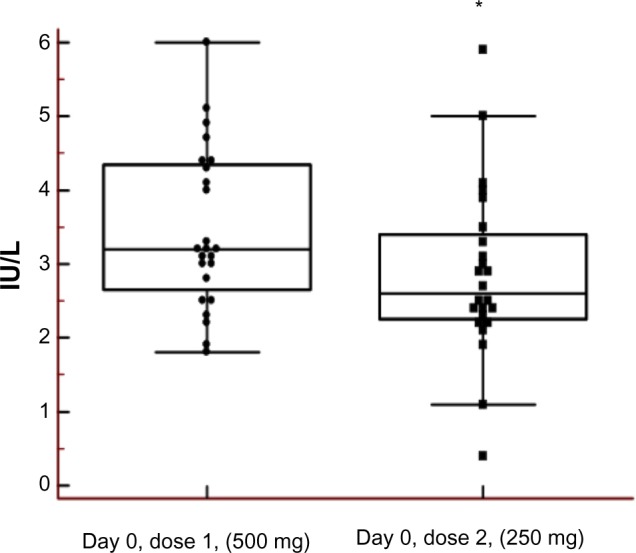
Figure 1.

Sustained effect on luteinizing hormone (LH) after injection of testosterone (500 mg).
Notes: Left box plot prior to dose, right box plot 6–8 weeks after. The asterisk denotes a statistically significant difference between Day 0, Dose 1 and Day 0, Dose 2 (*P=0.01 [Student’s paired t-test, results are mean ± standard deviation]) (2.85±1.16 IU/L) compared with Day 0 (3.46±1.08 IU/L) before the first dose. Two individuals even had serum-LH concentrations below the reference range (0.4 and 1.1 IU/L) before the second dose (Day 0), compared with Day 0 before the first dose (3.2 and 2.8 IU/L).
