
Table 1. Structure and Activities of Analogues 9.
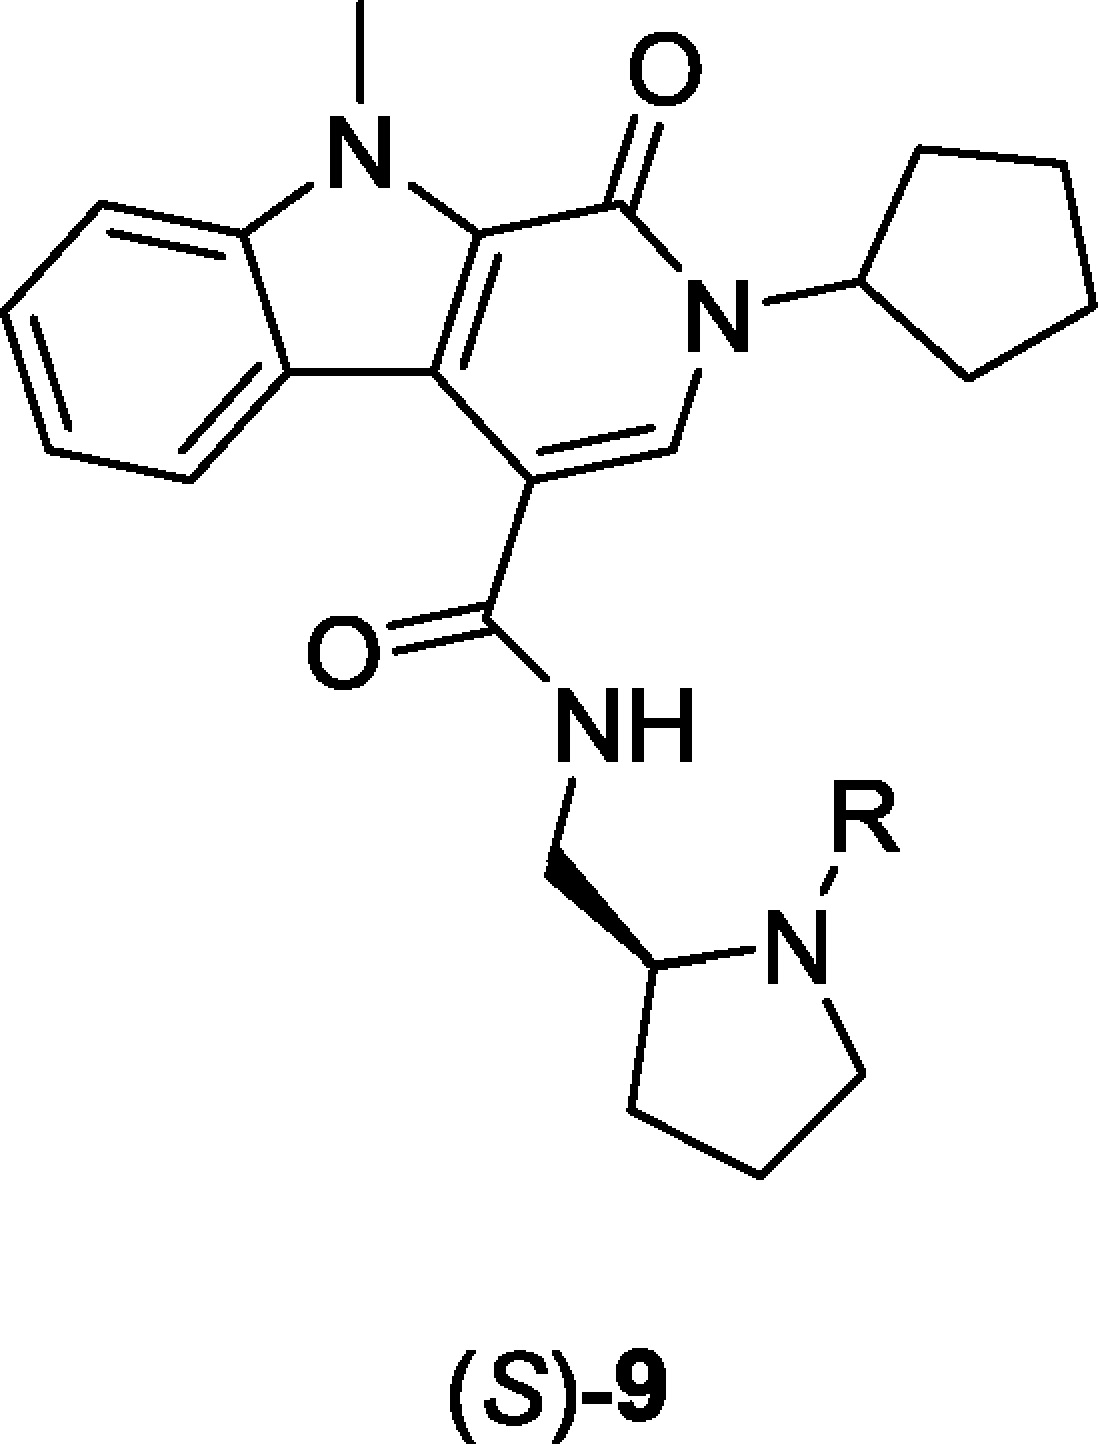
| entry | R | GLP-1R EC50 (μM) | GLP-1R pEC50a | GLP-1R maxa (%) |
|---|---|---|---|---|
| (S)-8 | Et | 2.4 | 5.69 ± 0.12 | 53.4 ± 2.03 |
| (S)-9a | n-Pr | 6.5 | 5.18 ± 0.13 | 48.4 ± 2.77 |
| (S)-9b | i-Pr | 1.3 | 5.88 ± 0.15 | 59.2 ± 2.53 |
| (S)-9c | 2-OMeBn | 12.1 | 4.92 ± 0.09 | 68.3 ± 3.31 |
| (S)-9d | n-hexyl | 10.3 | 4.99 ± 0.09 | 55.7 ± 2.63 |
| (S)-9e | CH2CH2Ph | 14.1 | 4.74 ± 0.19 | 68.5 ± 7.96 |
a
GLP-1 pEC50 and GLP-1 max data reported as averages + SEM from our calcium mobilization assay; n = 3.